Home
Class 11
MATHS
The following values are calculated in r...

The following values are calculated in respect of heights and weights of the students of a section of Class XI
:
Can we say that the weights show greater variation than the

Text Solution

Verified by Experts

Answer. Clearly C.V.(weights) is greater than C.V.(heights).
Weights show more variability than heights.
Promotional Banner

Topper's Solved these Questions

Similar Questions

Explore conceptually related problems

The following values are calculated in respect of heights and weights of the students of a section of class XI: Height Weight Mean 162.6 cm 52.36 kg Variance 127.69cm223.1361kg2 Can we say that the weights show greater variation than the heights?

The mans and standard deviations of heights ans weights of 50 students of a class are as follows: Weights Heights Mean 63.2kg63.2 inch standard deviation 5.6kg11. inch Which shows more variability,heights or weights?

Let us now consider the following frequency distribution table which gives the weights of 38 students of a class:

Following is the data showing weights of 40 students in a class . Find its median .

Following table shows the weights of 12 students: Find the mean weight.

The following bar graph (Figure) represents the heights (in cm) of 50 students of Class XI of a particular school. Study the graph and answer the following questions: What percentage of the total number of students have their heights more than 149 cm? How many students in the class are in the range of maximum height of the class? The school wants to provide a particular type of tonic to each student below the height of 150cm to improve his height. If the cost of the tonic for each student comes out to be Rs. 55, how much amount of money is required? How many students are in the range of shortest height of the class? State whether true or false: There are 9 students in the class whose heights are in the range of 155-159 cm. Maximum height (in cm) of a student in the class is 17. There are 29 students in the class whose heights are in the range of 145-154cm. Minimum height (in cm) of a student is the class is in the range of 140-144cms. The number of students in the class having their heights less than 150cm is 12. There are 14 students each of whom has height more than 154 cm.

The total number of students in sections A and B ofa class is 72. The ratio of the number of students in A and B is 7: 5. The average weight(in kg) of the students in section B is 20% more than that of the studentsin section A.If the average weight of all the students in the class is 52 kg, then whatis the average weight (in kg) of the students in section B?

Following frequency distribution gives the weights of 40 students of a class . A student from the class is chosen at random . What is the probability that the weight of the chosen student is (i) at most 60 kg (ii) at least 56 kg (iii) not more than 50 kg ?

NCERT-STATISTICS-SOLVED EXAMPLES
  1. Calculate mean, Variance and Standard Deviation for the following dis...

    Text Solution

    |

  2. Two plants A and B of a factory show following results about the numb...

    Text Solution

    |

  3. Calculate the mean, variance and standard deviation for the following...

    Text Solution

    |

  4. Find the standard deviation for the following data :

    Text Solution

    |

  5. The variance of 20 observations is 5. If each observation is multipli...

    Text Solution

    |

  6. The mean of 5 observations is 4.4 and their variance is 8.24. If thre...

    Text Solution

    |

  7. Coefficient of variation of two distributions are 60 and 70, and thei...

    Text Solution

    |

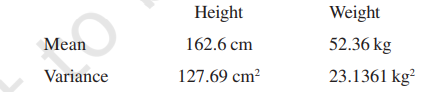
  8. The following values are calculated in respect of heights and weights ...

    Text Solution

    |

  9. If each of the observation x1,x2,.........,xnis increased by a where a...

    Text Solution

    |

  10. The mean and standard deviation of 100 observations were calculated a...

    Text Solution

    |

  11. Find the variance and standard deviation for the following data:

    Text Solution

    |

  12. Find the Variance of the following data:6, 8, 10 , 12 , 14 , 16 , 18 ,...

    Text Solution

    |

  13. Find the mean deviation about the median for the following data:

    Text Solution

    |

  14. Find mean deviation about the mean for the following data :xi 2 5 6 8 ...

    Text Solution

    |

  15. Calculate the mean deviation about median for the following data :

    Text Solution

    |

  16. Find the mean deviation about the mean for the following data.

    Text Solution

    |

  17. Find the mean deviation about the mean for the following data: 6, 7, 1...

    Text Solution

    |

  18. Find the mean deviation about the median for the following data:3, 9, ...

    Text Solution

    |