


Similar Questions
Explore conceptually related problems
Recommended Questions
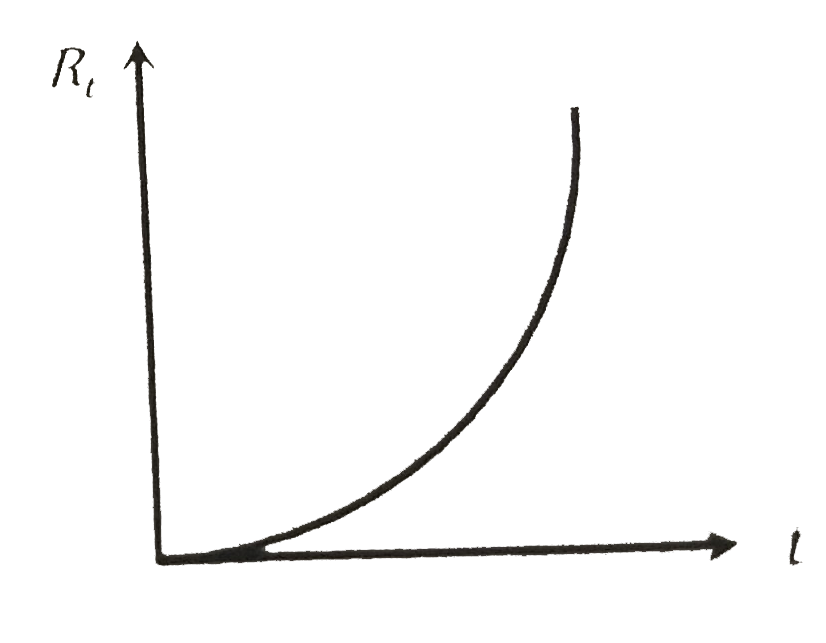
- The resistance t R of a conductor varies with temperature t as shown ...
Text Solution
|
- Resistance of a resistor at temperature t^@C is Rt =R0 (1+alphat + bet...
Text Solution
|
- The temperature coefficient of resistance of conductor varies as alpha...
Text Solution
|
- The activity of a radioactive substance is R(0) at t = 0, R(1) at t = ...
Text Solution
|
- The resistance t R of a conductor varies with temperature t as shown ...
Text Solution
|
- Let R(t) represents activity of a sample at an insant and N(t) represe...
Text Solution
|
- Resistance of a resistor at temperature t^(@)C is R(f)=R(0)(1+alpha t+...
Text Solution
|
- The resistance R(o) and R(t) of a metallic wire at temperature 0^(@)C ...
Text Solution
|
- t^(@)C Resistance of a resistor at R(t)=R(0) (1+alphat+beta t^(2)) Is ...
Text Solution
|