


Similar Questions
Explore conceptually related problems
Recommended Questions
- A voltage waveform is as shown in the Figure calculate the ratio of rm...
Text Solution
|
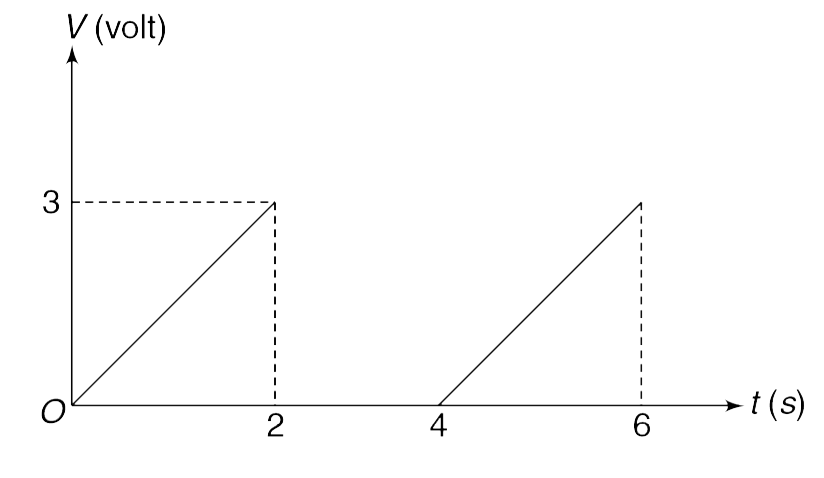
- Find the rms and the average values of the saw tooth waveform shown in...
Text Solution
|
- The rms and the average value of the voltage wave shown in figure are
Text Solution
|
- Find the rms and average value of the wavefrom shown in figure
Text Solution
|
- Which of the two waveforms shown in Figure has a higher average value?
Text Solution
|
- Which of the two waveforms shown in Figure has a higher rms value?
Text Solution
|
- A voltage waveform is as shown in the Figure calculate the ratio of rm...
Text Solution
|
- A periodic voltage V varies with time t as shown in the figure 5.249. ...
Text Solution
|
- The average and RMS value of voltage for square wave shown in figure-5...
Text Solution
|