Text Solution
Verified by Experts
The correct Answer is:


Topper's Solved these Questions
Similar Questions
Explore conceptually related problems
DC PANDEY-BASIC MATHEMATICS-Exercise
- Find the value of (a) cot 300^(@) (b) tan 330^(@) (c) cos (-60)...
Text Solution
|
- Find the value of
Text Solution
|
- Differentiate the following functions with respect to x x^(4) + 3x^...
Text Solution
|
- Integrate the following functions with respect to t
Text Solution
|
- Integrate the following function int(o)^(2) 2t dt
Text Solution
|
- Find maximum/maximum value of y in the functions given below (a) y=5...
Text Solution
|
- What is the slope of following lines graphs (a) y = 4x
Text Solution
|
- For the graphs given below, write down their x -y equations
Text Solution
|
- For the equations given below, tell the nature of graphs. (a) y =2x^...
Text Solution
|
- Value of y decreases exponentially from y =10 to y =6. plot a x-y grap...
Text Solution
|
- Value of y increases exponentially from y =- 4 to y = + 4. Plot a x-y...
Text Solution
|
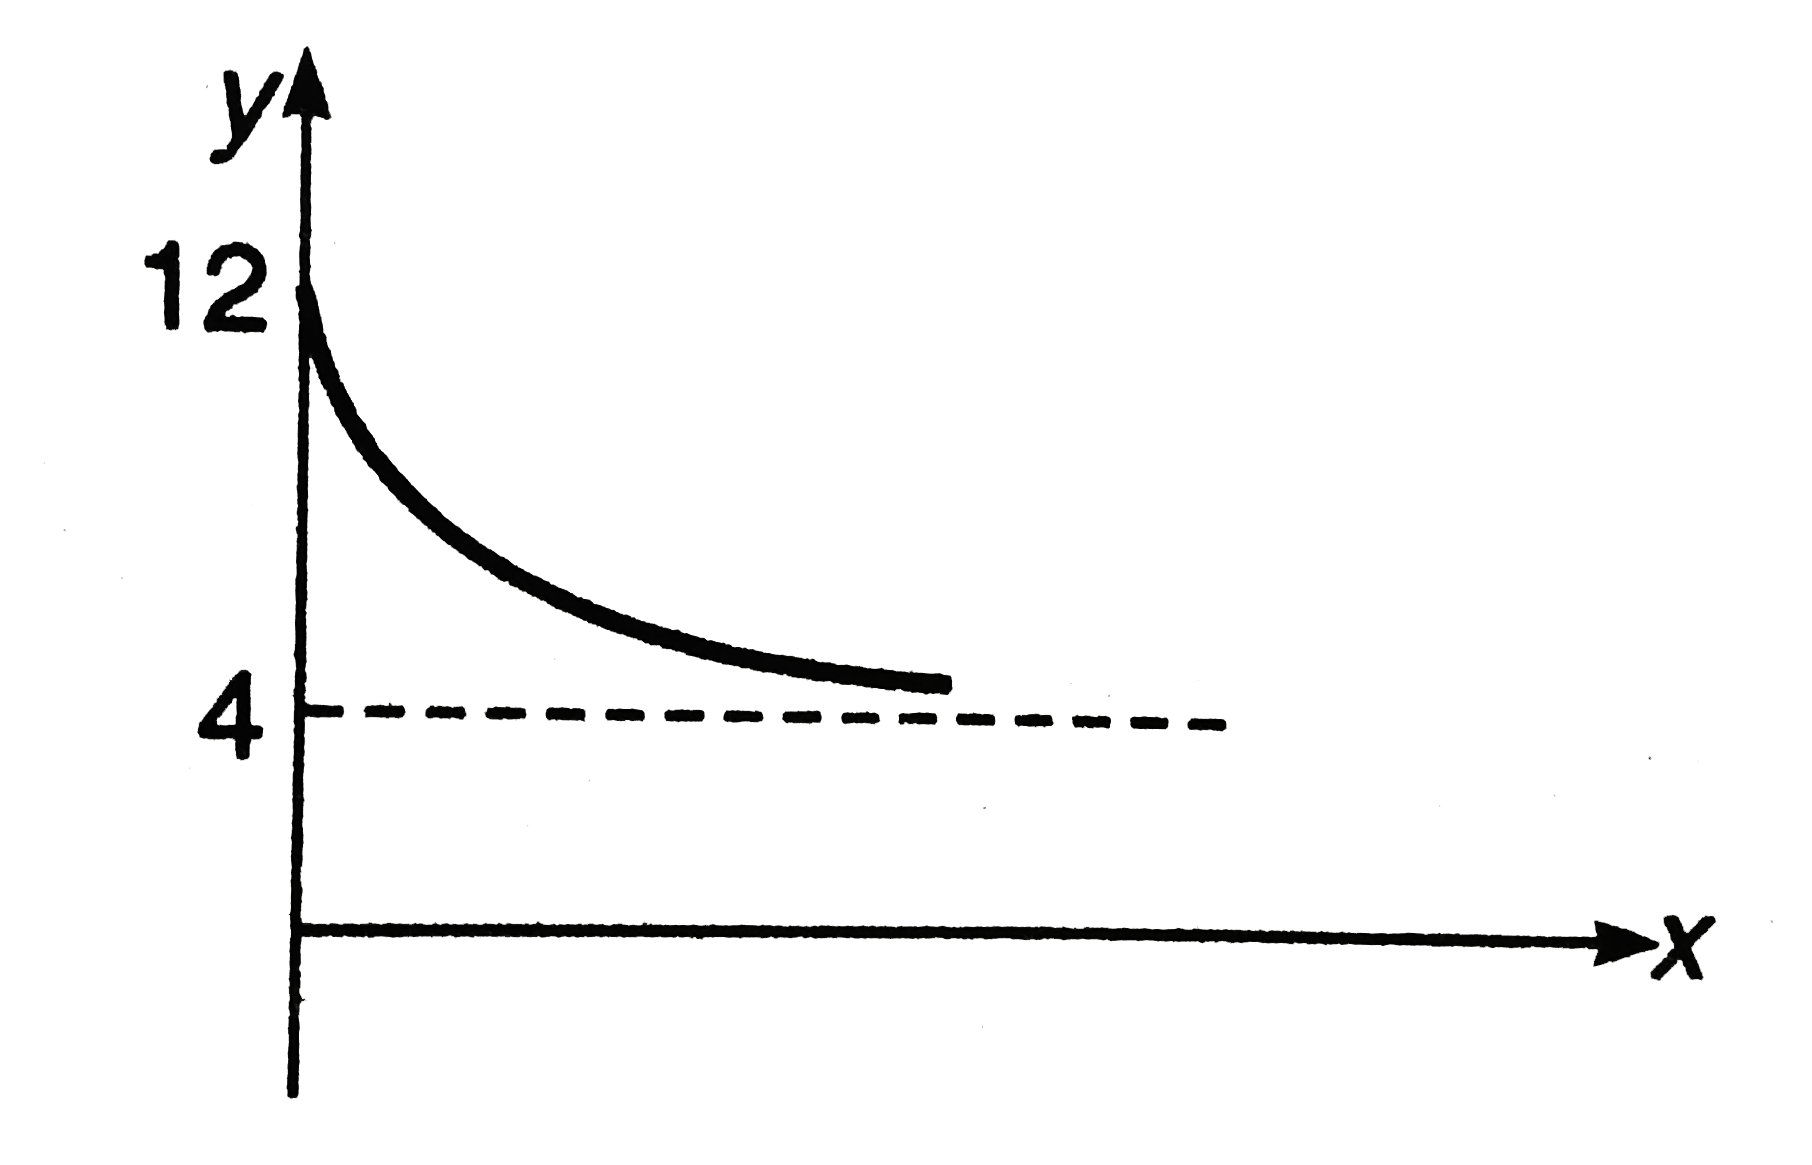
- The graph shown in figure is exponential. Write down the equation corr...
Text Solution
|
- The graph shows in figure is exponential. Write down the equation corr...
Text Solution
|