Text Solution
Verified by Experts
The correct Answer is:


Topper's Solved these Questions
Similar Questions
Explore conceptually related problems
DC PANDEY-KINEMATICS-Exercise 6.9
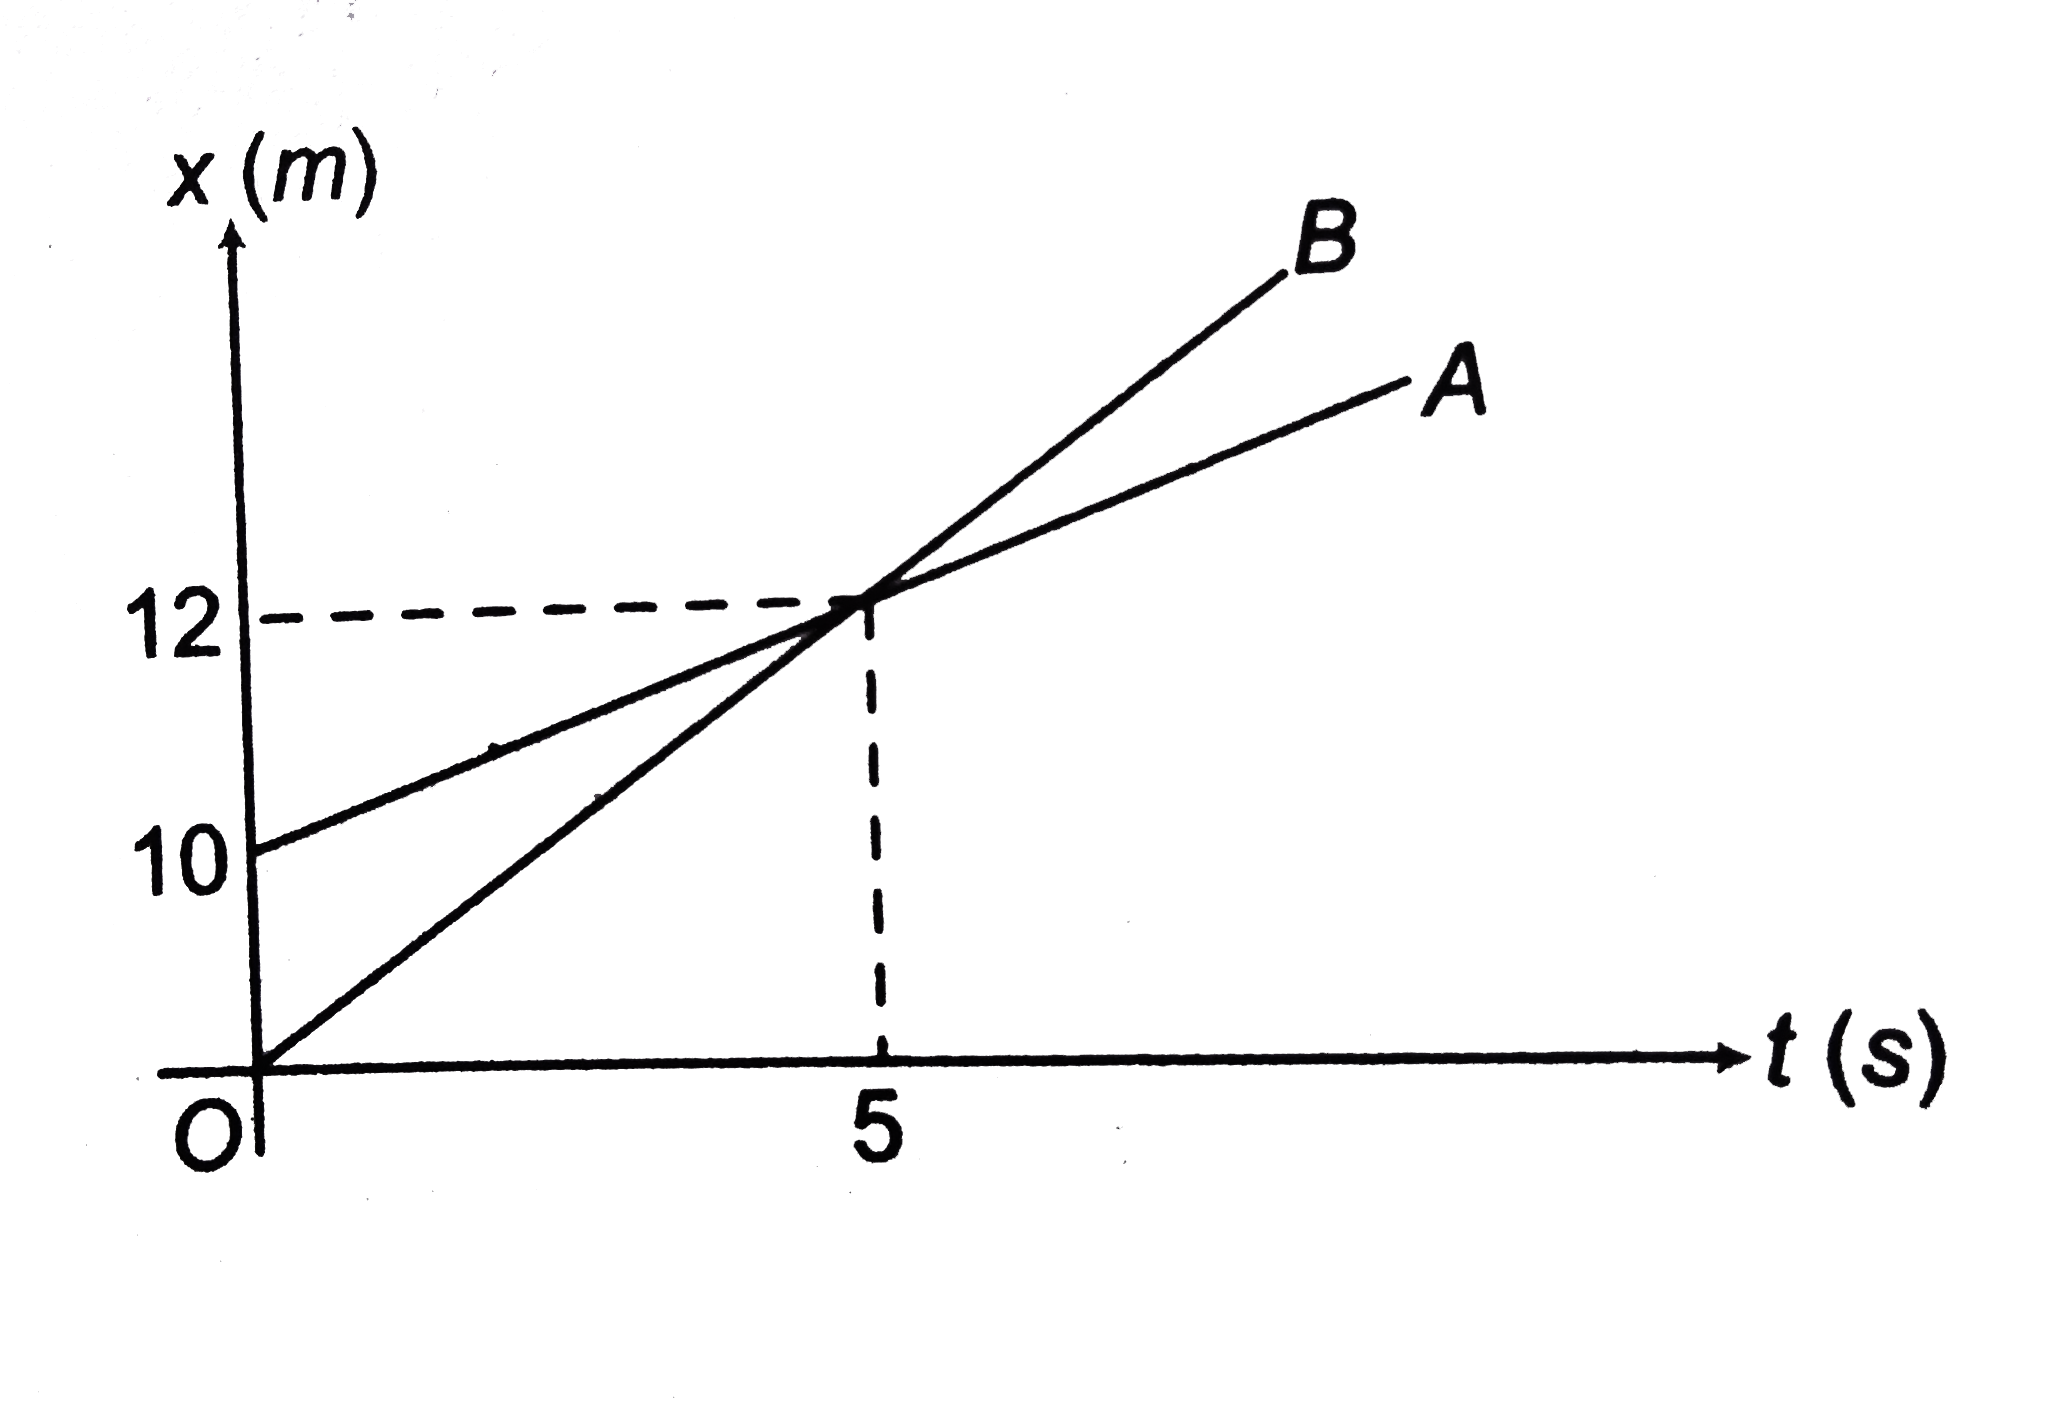
- Two particles are moving along x-axis. Their x-coordinate versus time ...
Text Solution
|
- Two balls A and B are projected vertically upwards with different velo...
Text Solution
|
- A river 400 m wide is flowing at a rate of 2.0 m//s. A boat is sailing...
Text Solution
|
- An aeroplane has to go from a point A to another point B, 500 km away ...
Text Solution
|
- A man crosses a river in a boat. If he cross the river in minimum time...
Text Solution
|
- A river is 20 m wide. River speed is 3 m//s. A boat starts with veloci...
Text Solution
|