Text Solution
Verified by Experts
The correct Answer is:


Topper's Solved these Questions
Similar Questions
Explore conceptually related problems
DC PANDEY-KINEMATICS-Subjective
- Velocity of particle moving along positive x-direction is v = (40-10t)...
Text Solution
|
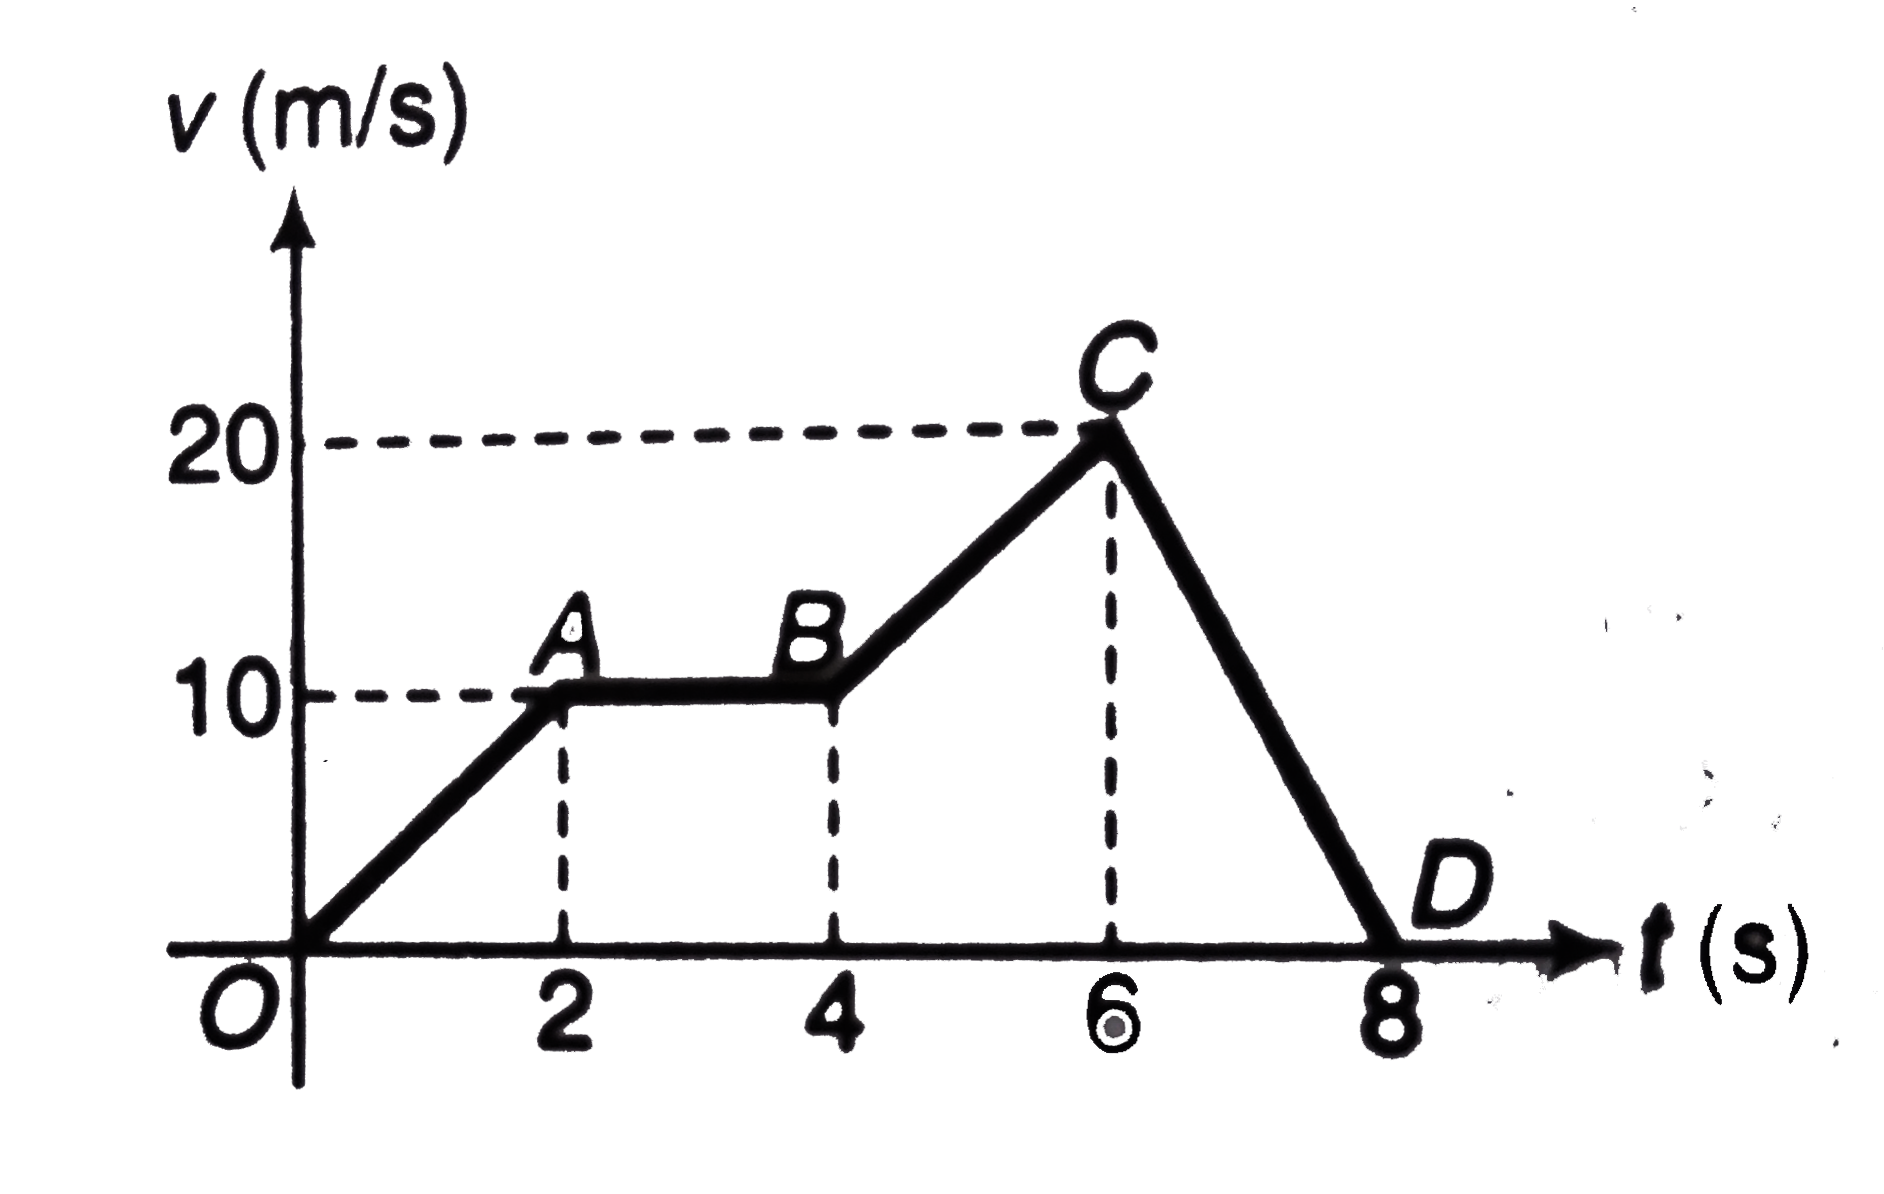
- Velocity-time graph of a particle moving in a straight line is shown i...
Text Solution
|
- Acceleration-time graph of a particle moving in a straight line is as ...
Text Solution
|
- A particle is moving in x-y p1ane.At time t=0, particle is at (1m, 2m)...
Text Solution
|
- A stone is dropped from the top of a tower. When it crosses a point 5 ...
Text Solution
|
- A point mass starts moving in a straight line with constant accelerati...
Text Solution
|
- A football is kicked vertically upward from the ground and a student g...
Text Solution
|
- A car moving with constant acceleration covered the distance between t...
Text Solution
|
- A particle moves along the x-direction with constant acceleration. The...
Text Solution
|
- At time t= 0, a particle is at (2m, 4m). It starts moving towards posi...
Text Solution
|
- A particle starts from the origin at t= 0 with a velocity of 8.0 hat j...
Text Solution
|
- The velocity of a particle moving in a straight line is decreasing at ...
Text Solution
|
- A particle moves along a horizontal path, such that its velocity is gi...
Text Solution
|
- A particle travels m a straight line, such that for a short time 2 s l...
Text Solution
|
- If the velocity v of a particle moving along a straight line decreases...
Text Solution
|
- Velocity-time graph of a particle moving in a straight line is shown i...
Text Solution
|
- Velocity-time graph of a particle moving in a straight line is shown i...
Text Solution
|
- A particle of mass m is released from a certain height h with zero ini...
Text Solution
|
- A ball is dropped from a height of 80 m on a floor. At each collision,...
Text Solution
|
- Figure shows the acceleration-time graph of a particle moving along a ...
Text Solution
|