 ,
, A
B
C
D
Text Solution
Verified by Experts
The correct Answer is:


Similar Questions
Explore conceptually related problems
Recommended Questions
- Asseration : Displacement time graph of a particle moving in a straigh...
Text Solution
|
- Velocity-time graph of a particle of mass (2 kg) moving in a straight ...
Text Solution
|
- Asseration : Displacement time graph of a particle moving in a straigh...
Text Solution
|
- The velocity-time graph of a particle moving in a straight line is sho...
Text Solution
|
- Acceleration time graph of a particle is shown work done by all the fo...
Text Solution
|
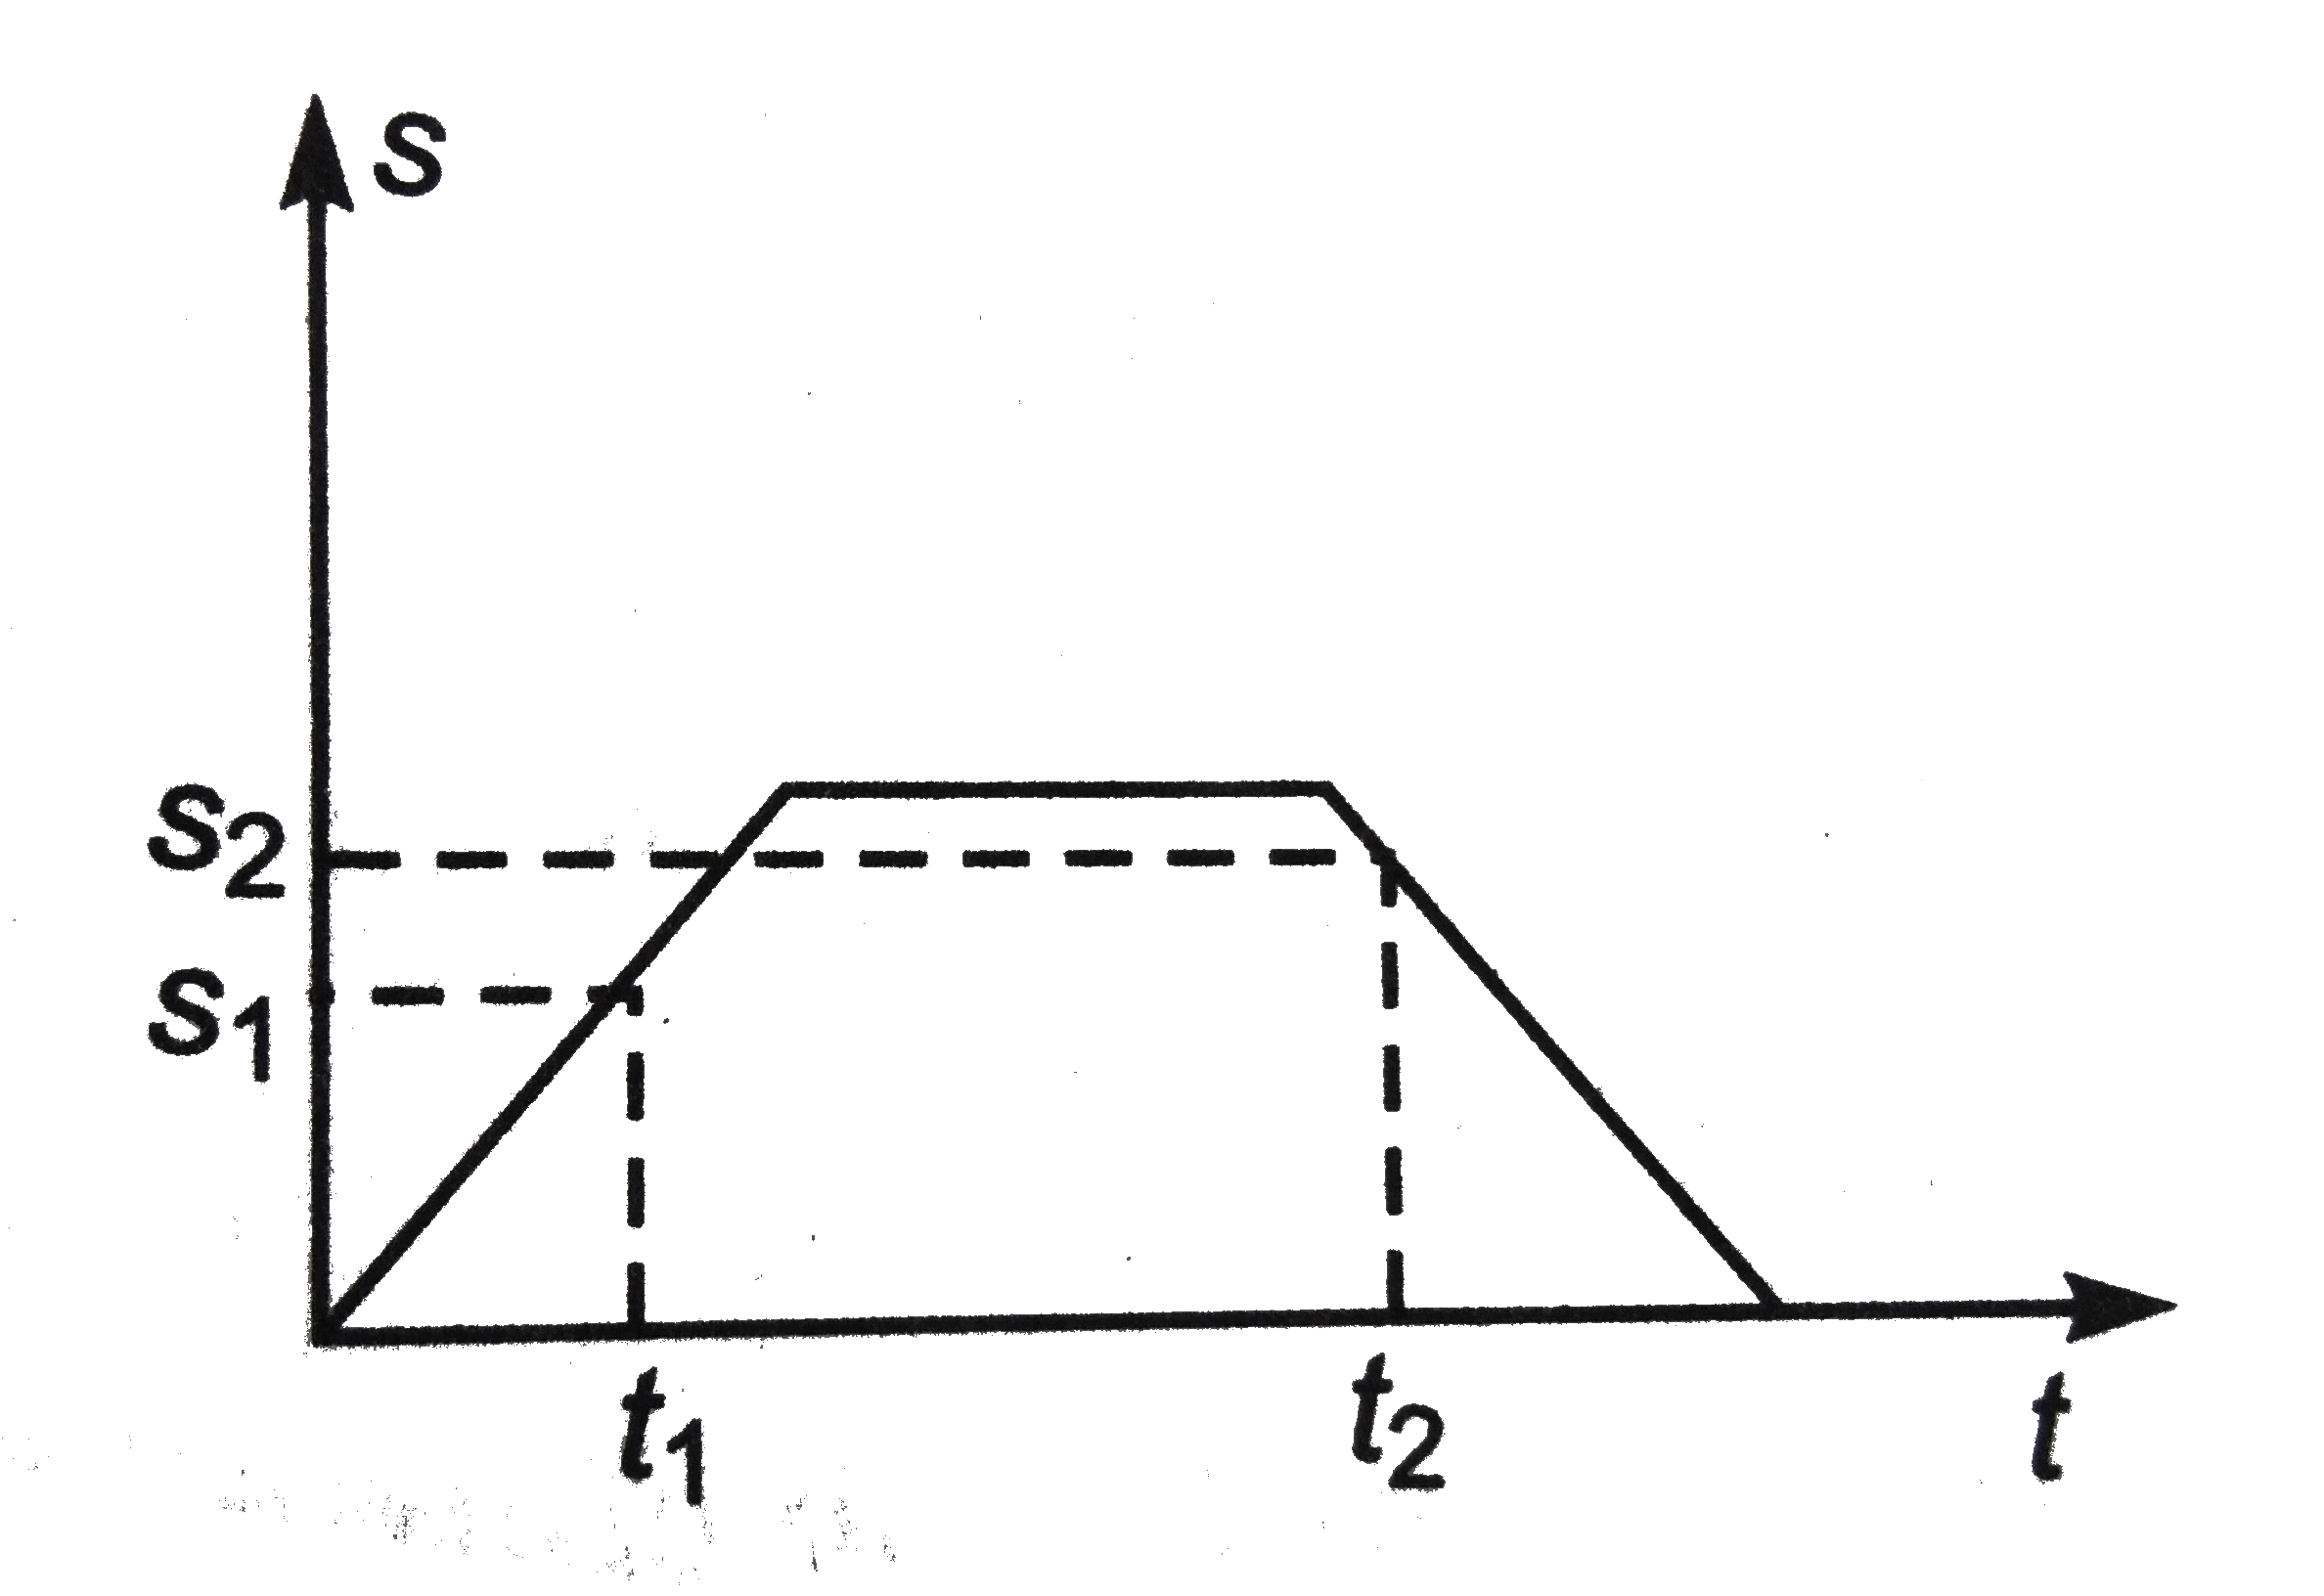
- Displacement time graph of a particle moving in a straight line is as ...
Text Solution
|
- Choose the correct options – (1) )The work done by forces may be equal...
Text Solution
|
- A particle is moving along a straight line. Its displacement-time grap...
Text Solution
|
- Velocity-time graph of a particle moving in a straight line is shown i...
Text Solution
|