A
B
C
D
Text Solution
Verified by Experts
The correct Answer is:


Similar Questions
Explore conceptually related problems
Recommended Questions
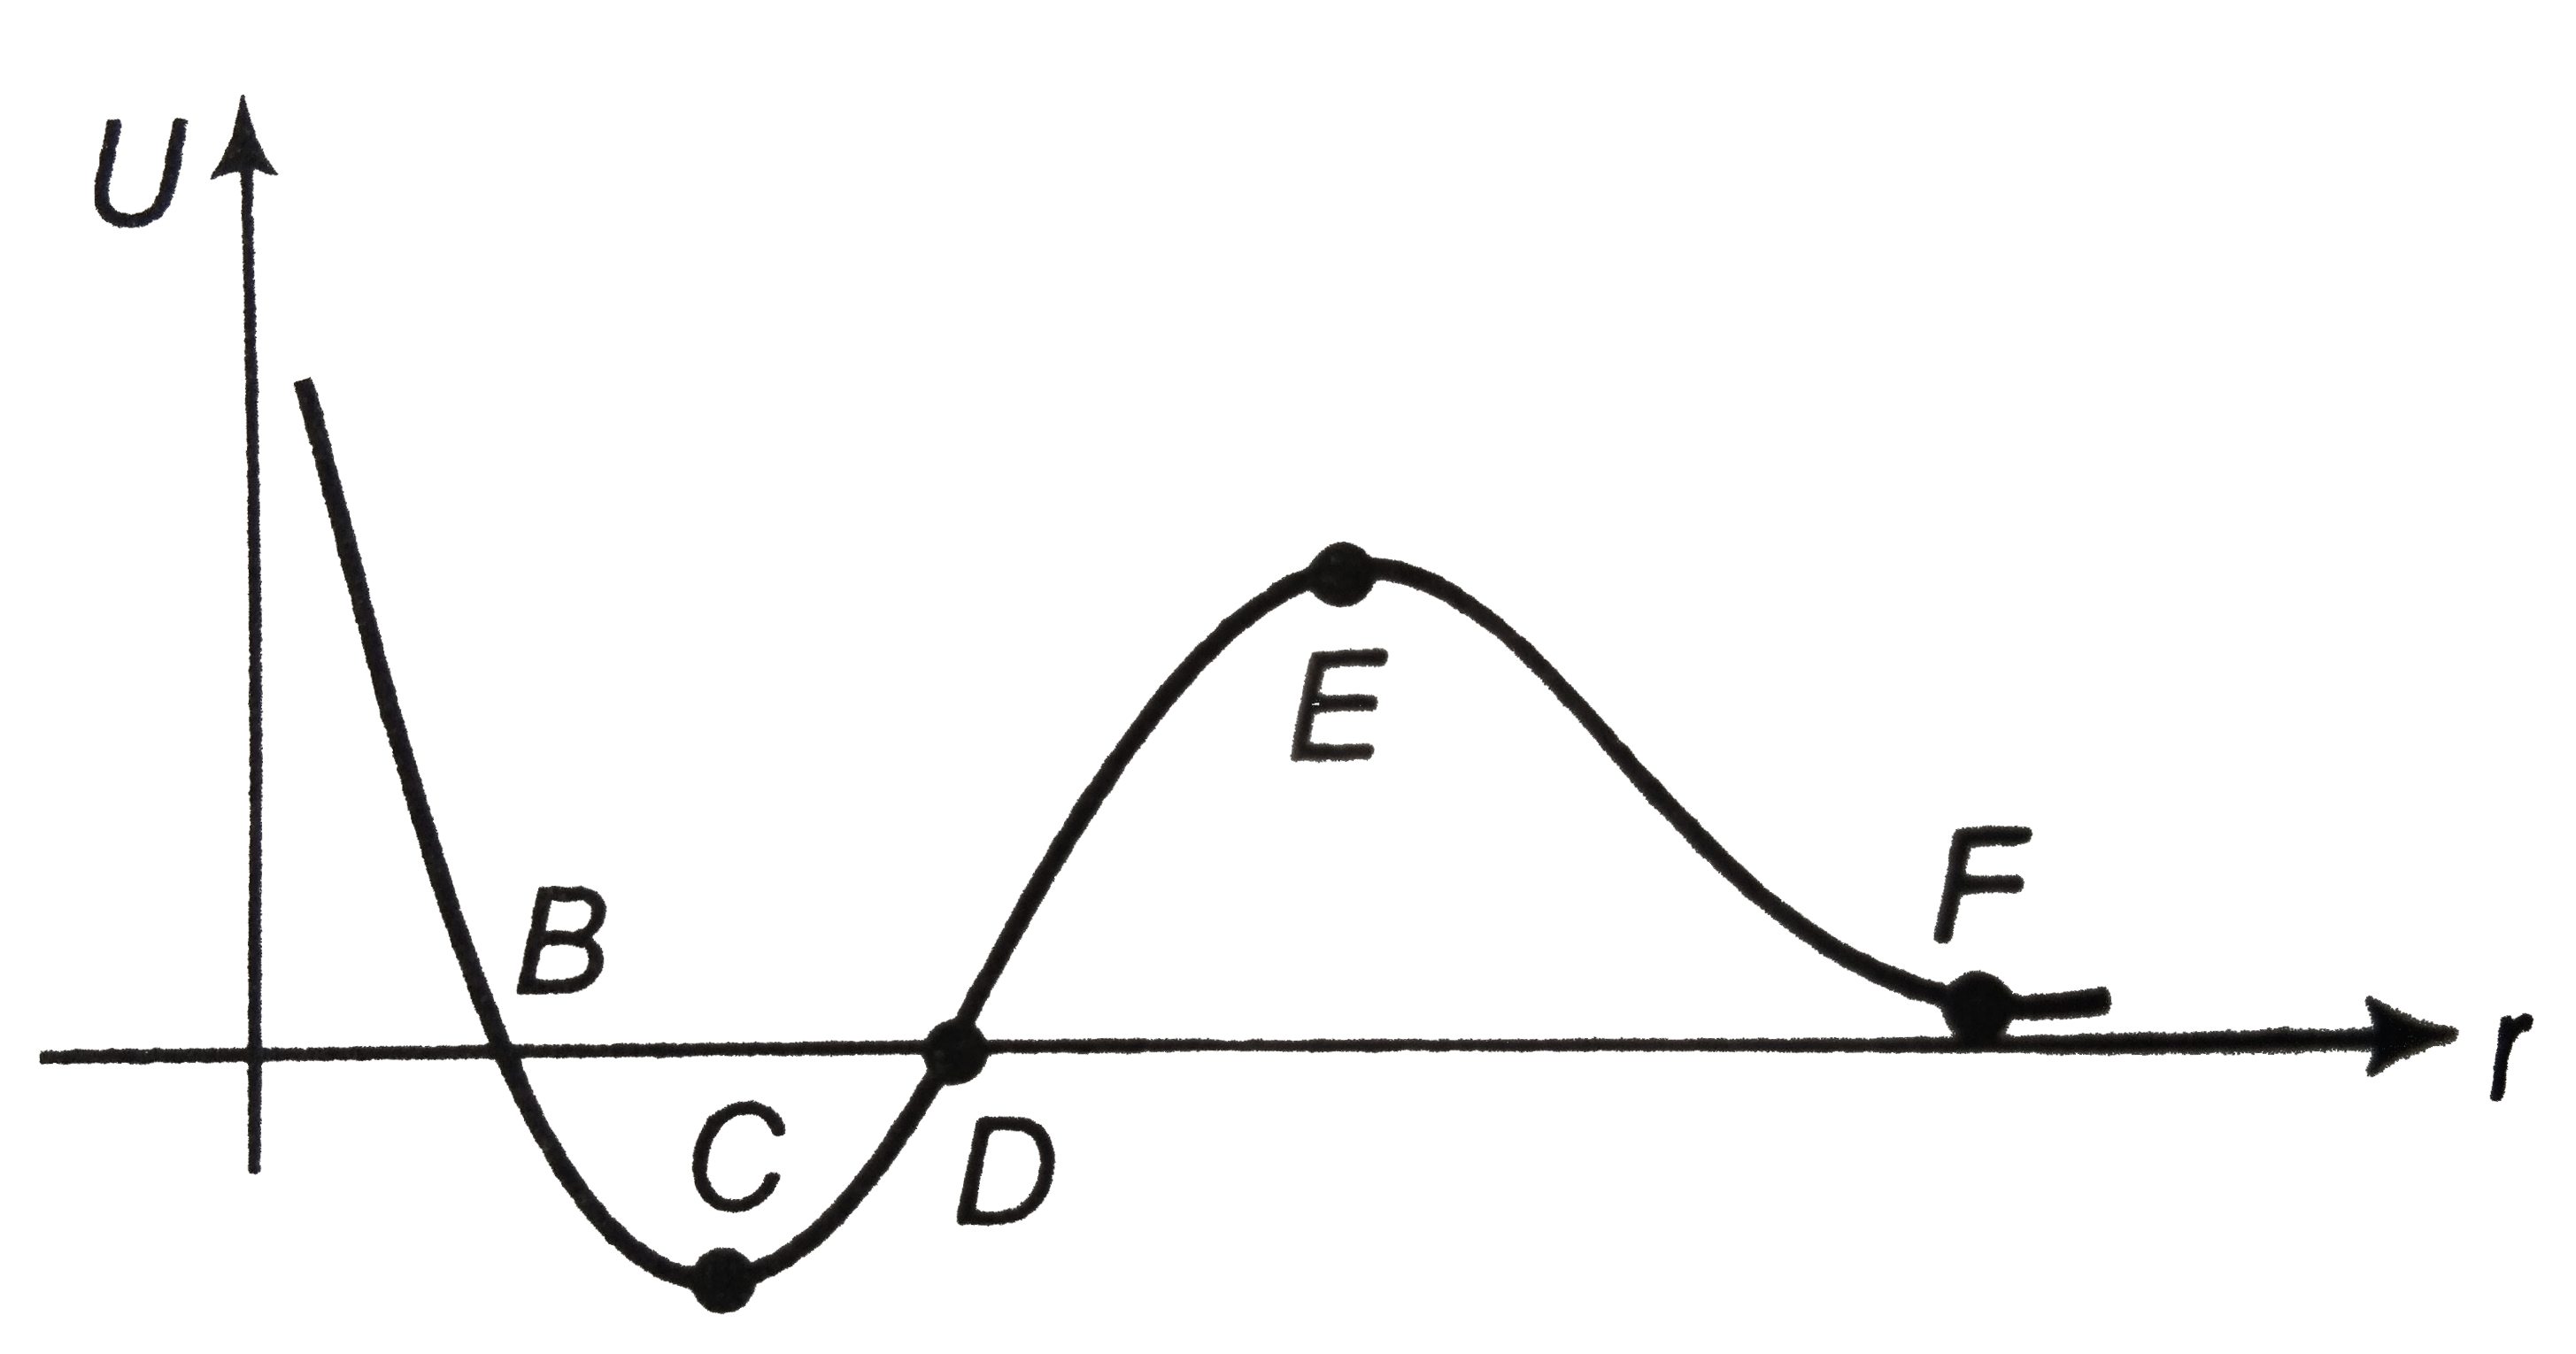
- The given plot shows the variation of U, the potential energy of inter...
Text Solution
|
- The potential energy of a two particle system separated by a distance ...
Text Solution
|
- The given plot shows the variation of U, the potential energy of inter...
Text Solution
|
- Potential Energy U(x) and associated force F(x) bears the relation F(x...
Text Solution
|
- The following plot shows the variation of potential energy (U) of a sy...
Text Solution
|
- Assertion : On decreasing the distance between two masses potential en...
Text Solution
|
- If the potential energy between two molecules is given by U= -(A)/(r^6...
Text Solution
|
- कथन :दो द्रव्यमानों के मध्य की दूरी कम करने पर स्थितिज ऊर्जा बढ़ती है।...
Text Solution
|
- If the potential energy between two molecules is given by U= -(A)/(r^6...
Text Solution
|