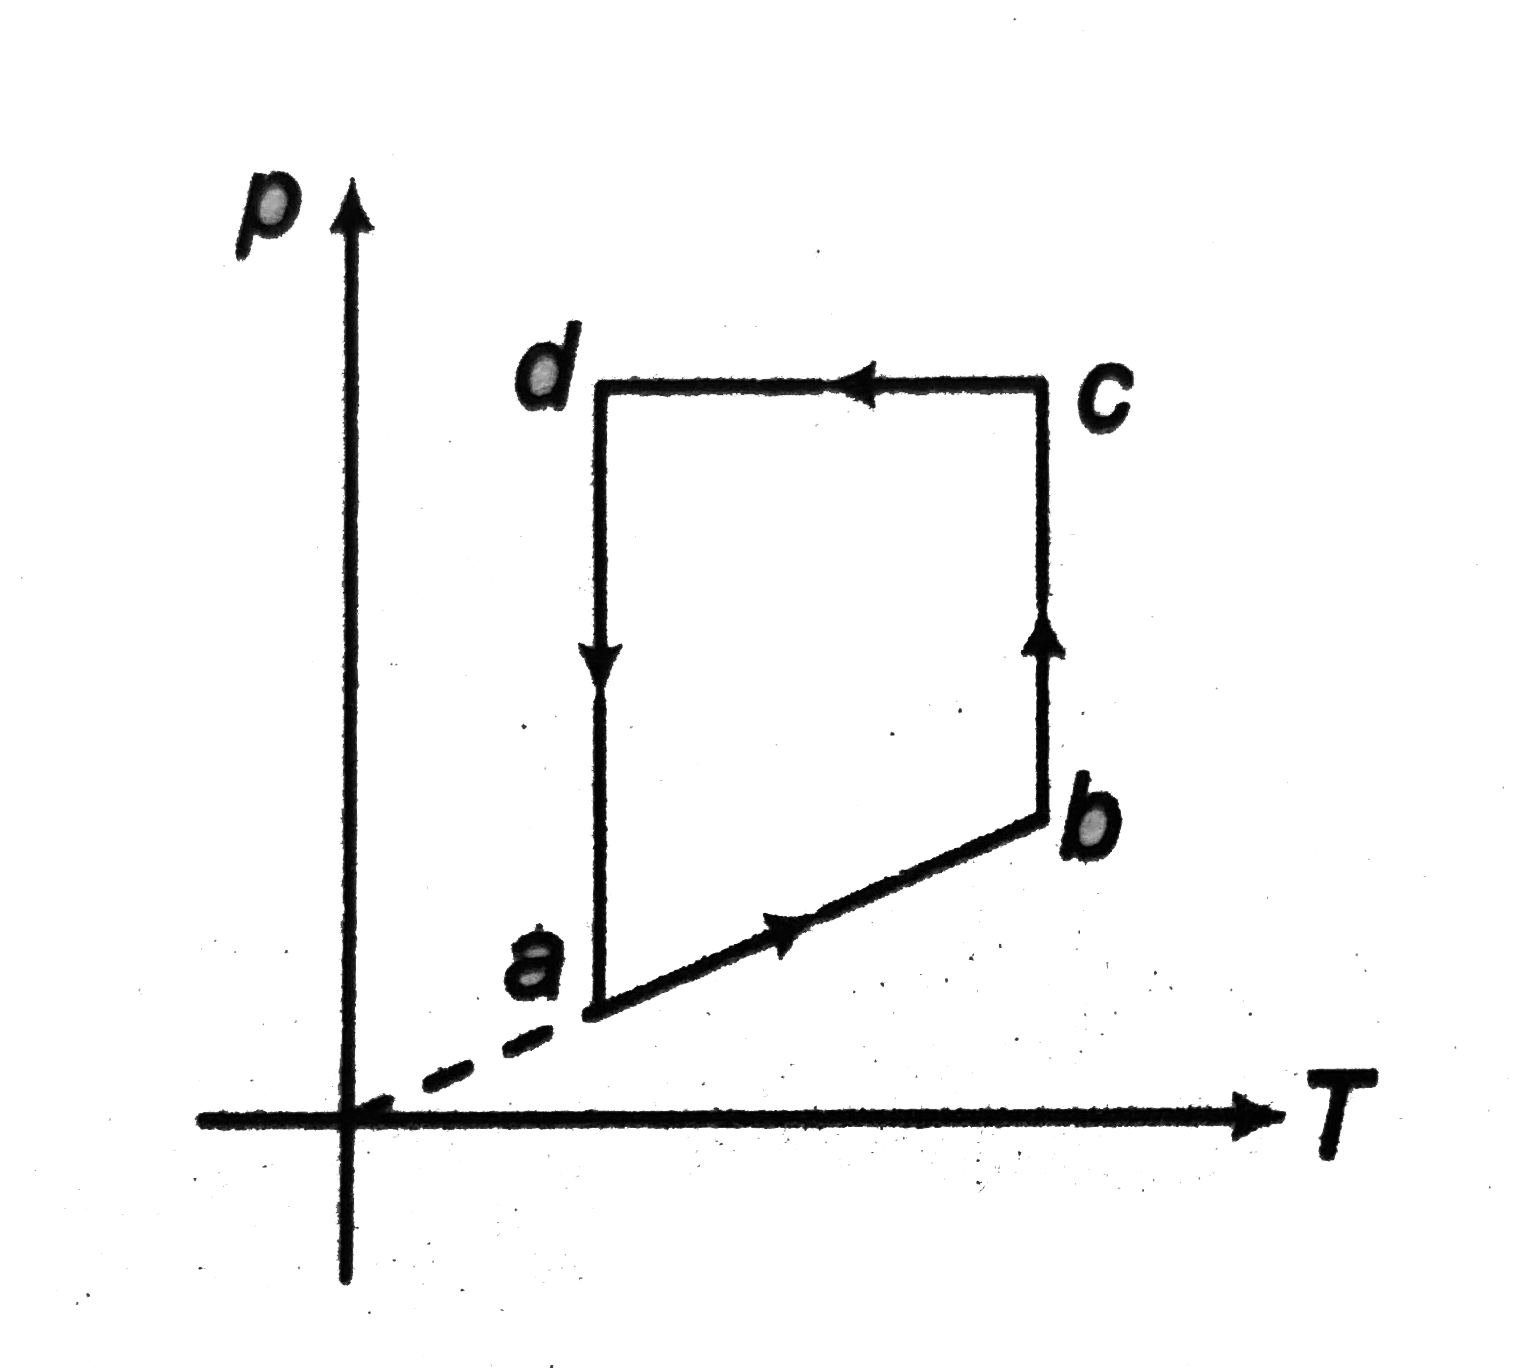
Corresponding to (p - T) graph as shown in figure, draw
(a) P - V graph
(b) V - T graph
( c) `rho` - T graph and
(d) U - T graph.
Corresponding to (p - T) graph as shown in figure, draw
(a) P - V graph
(b) V - T graph
( c) `rho` - T graph and
(d) U - T graph.
Text Solution
Verified by Experts
The correct Answer is:
A
(ab process) From the given graph, we can see that
`(p prop T)`
`rArr (V = "constant") (isochoric)
or `(rho = "constant") (as `rho prop 1/v)`
`(p)` and `(T)` both are increasing.
Therefore, U is also increasing ( as `u prop T)`
Now,
(i) (p - V) graph is straight line parallel to (p - axis) as (V) is constant.
(ii) (V - T) graph is a straight line parallel to (T - axis) as (V) is constant.
(iii) (p - T) graph is a straight line parallel to (T - axis) as (rho) is constant.
(iv) (U - T) graph is a straight line passing through origin as `( U prop T)`.
(bc process) From the given graph, we can see that
(T = constant) (isothermal)
rArr (U = constant)
` rArr (pV = "constant")`
or `p prop 1/V`
(p) is increasing. Therefore, (V) will decrease.
Hence, `(rho)` will increase.
now,
(i) (p - V) graph is a rectangular hyperbola ( as P prop 1/V).
(ii) `(V - T)` graph is a straight line parallel to (`V` - axis), as (`T =` constant)
(iii) `(rho - T)` graph is a striaght line parallel to ( rho - axis), as (T = constant)
(iv) ( U - T) graph is a dot, as (U) and (T) both are constants.
(cd process) From the given graph, we can see that
( p = constant)
rArr ( V prop T) (isobaric)
Temperature is decreasing. So, volume will also decrease. But density will increase.
Now,
(i) (p - V) graph is a straight line parallel to (V - axis) because (p) is constant.
(ii) (V - T) graph is a straight line passing through origin, as ( V prop T).
Now,
(i) (p - V) graph is a straight line parallel to (V - axis) because (p) is constant.
(ii) (V - T) graph is a straight line passing through origin, as ( V prop T).
(iii) ` rho = (pM)/(RT) rArr rho prop 1/T` as (p), (M) and (R) al are constants. Hence, `(rho - T)` graph is rectangular hyperbola.
(iv) (U - T) graph is a straight line passing through origin as `( U prop T)`.
(da process) This process is just inverse of (bc) process. So, this process will complete the cycle following the steps discussed in process (bc).
The four graphs are as shown below.
(##DCP_V03_C20_S01_024_S01##).


Topper's Solved these Questions
THERMOMETRY,THERMAL EXPANSION & KINETIC THEORY OF GASES
DC PANDEY|Exercise Example Type 2|1 VideosTHERMOMETRY,THERMAL EXPANSION & KINETIC THEORY OF GASES
DC PANDEY|Exercise Example Type 3|2 VideosTHERMOMETRY,THERMAL EXPANSION & KINETIC THEORY OF GASES
DC PANDEY|Exercise Level 2 Subjective|9 VideosTHERMOMETRY THERMAL EXPANSION AND KINETIC THEORY OF GASES
DC PANDEY|Exercise Medical entrance gallary|30 VideosUNIT AND DIMENSIONS
DC PANDEY|Exercise Assertion And Reason|2 Videos
Similar Questions
Explore conceptually related problems
The x -t graph shown in figure represents
Corresponding to y - t graph of a transverse harmonic wave shown in figure,
F-x and corresponding U-x graphs are as shown in figure. Three point A, B and C in F-x graph may be corresponding to P, Q and R in the U-x graph. Match the following
F-x and corresponding U-x graph are as shown in figures. Three points A,B and C in F-x graph may be corresponding to P,Q and R in the U-x graph. Match the following.
Consider the following (P-T) graph for a fixed mass of gas: Correct P-V graph as:
In the V-T graph shown in the figure match the following columns.
The velocity- time (v-t) graph shown above illustrates
Slope Of X-T Graph|Reading Of V-T Graph