 .
.A
 .
.B
C
D
Text Solution
Verified by Experts
The correct Answer is:


Topper's Solved these Questions
THERMOMETRY,THERMAL EXPANSION & KINETIC THEORY OF GASES
DC PANDEY|Exercise Level 2 More Than One Correct|7 VideosTHERMOMETRY,THERMAL EXPANSION & KINETIC THEORY OF GASES
DC PANDEY|Exercise Level 2 Subjective|9 VideosTHERMOMETRY,THERMAL EXPANSION & KINETIC THEORY OF GASES
DC PANDEY|Exercise Level 1 Subjective|48 VideosTHERMOMETRY THERMAL EXPANSION AND KINETIC THEORY OF GASES
DC PANDEY|Exercise Medical entrance gallary|30 VideosUNIT AND DIMENSIONS
DC PANDEY|Exercise Assertion And Reason|2 Videos
Similar Questions
Explore conceptually related problems
DC PANDEY-THERMOMETRY,THERMAL EXPANSION & KINETIC THEORY OF GASES-Level 2 Single Correct
- Two thermally insulated vessel 1 and 2 are filled with air at temperat...
Text Solution
|
- Two marks on a glass rod 10 cm apart are found to increase their dista...
Text Solution
|
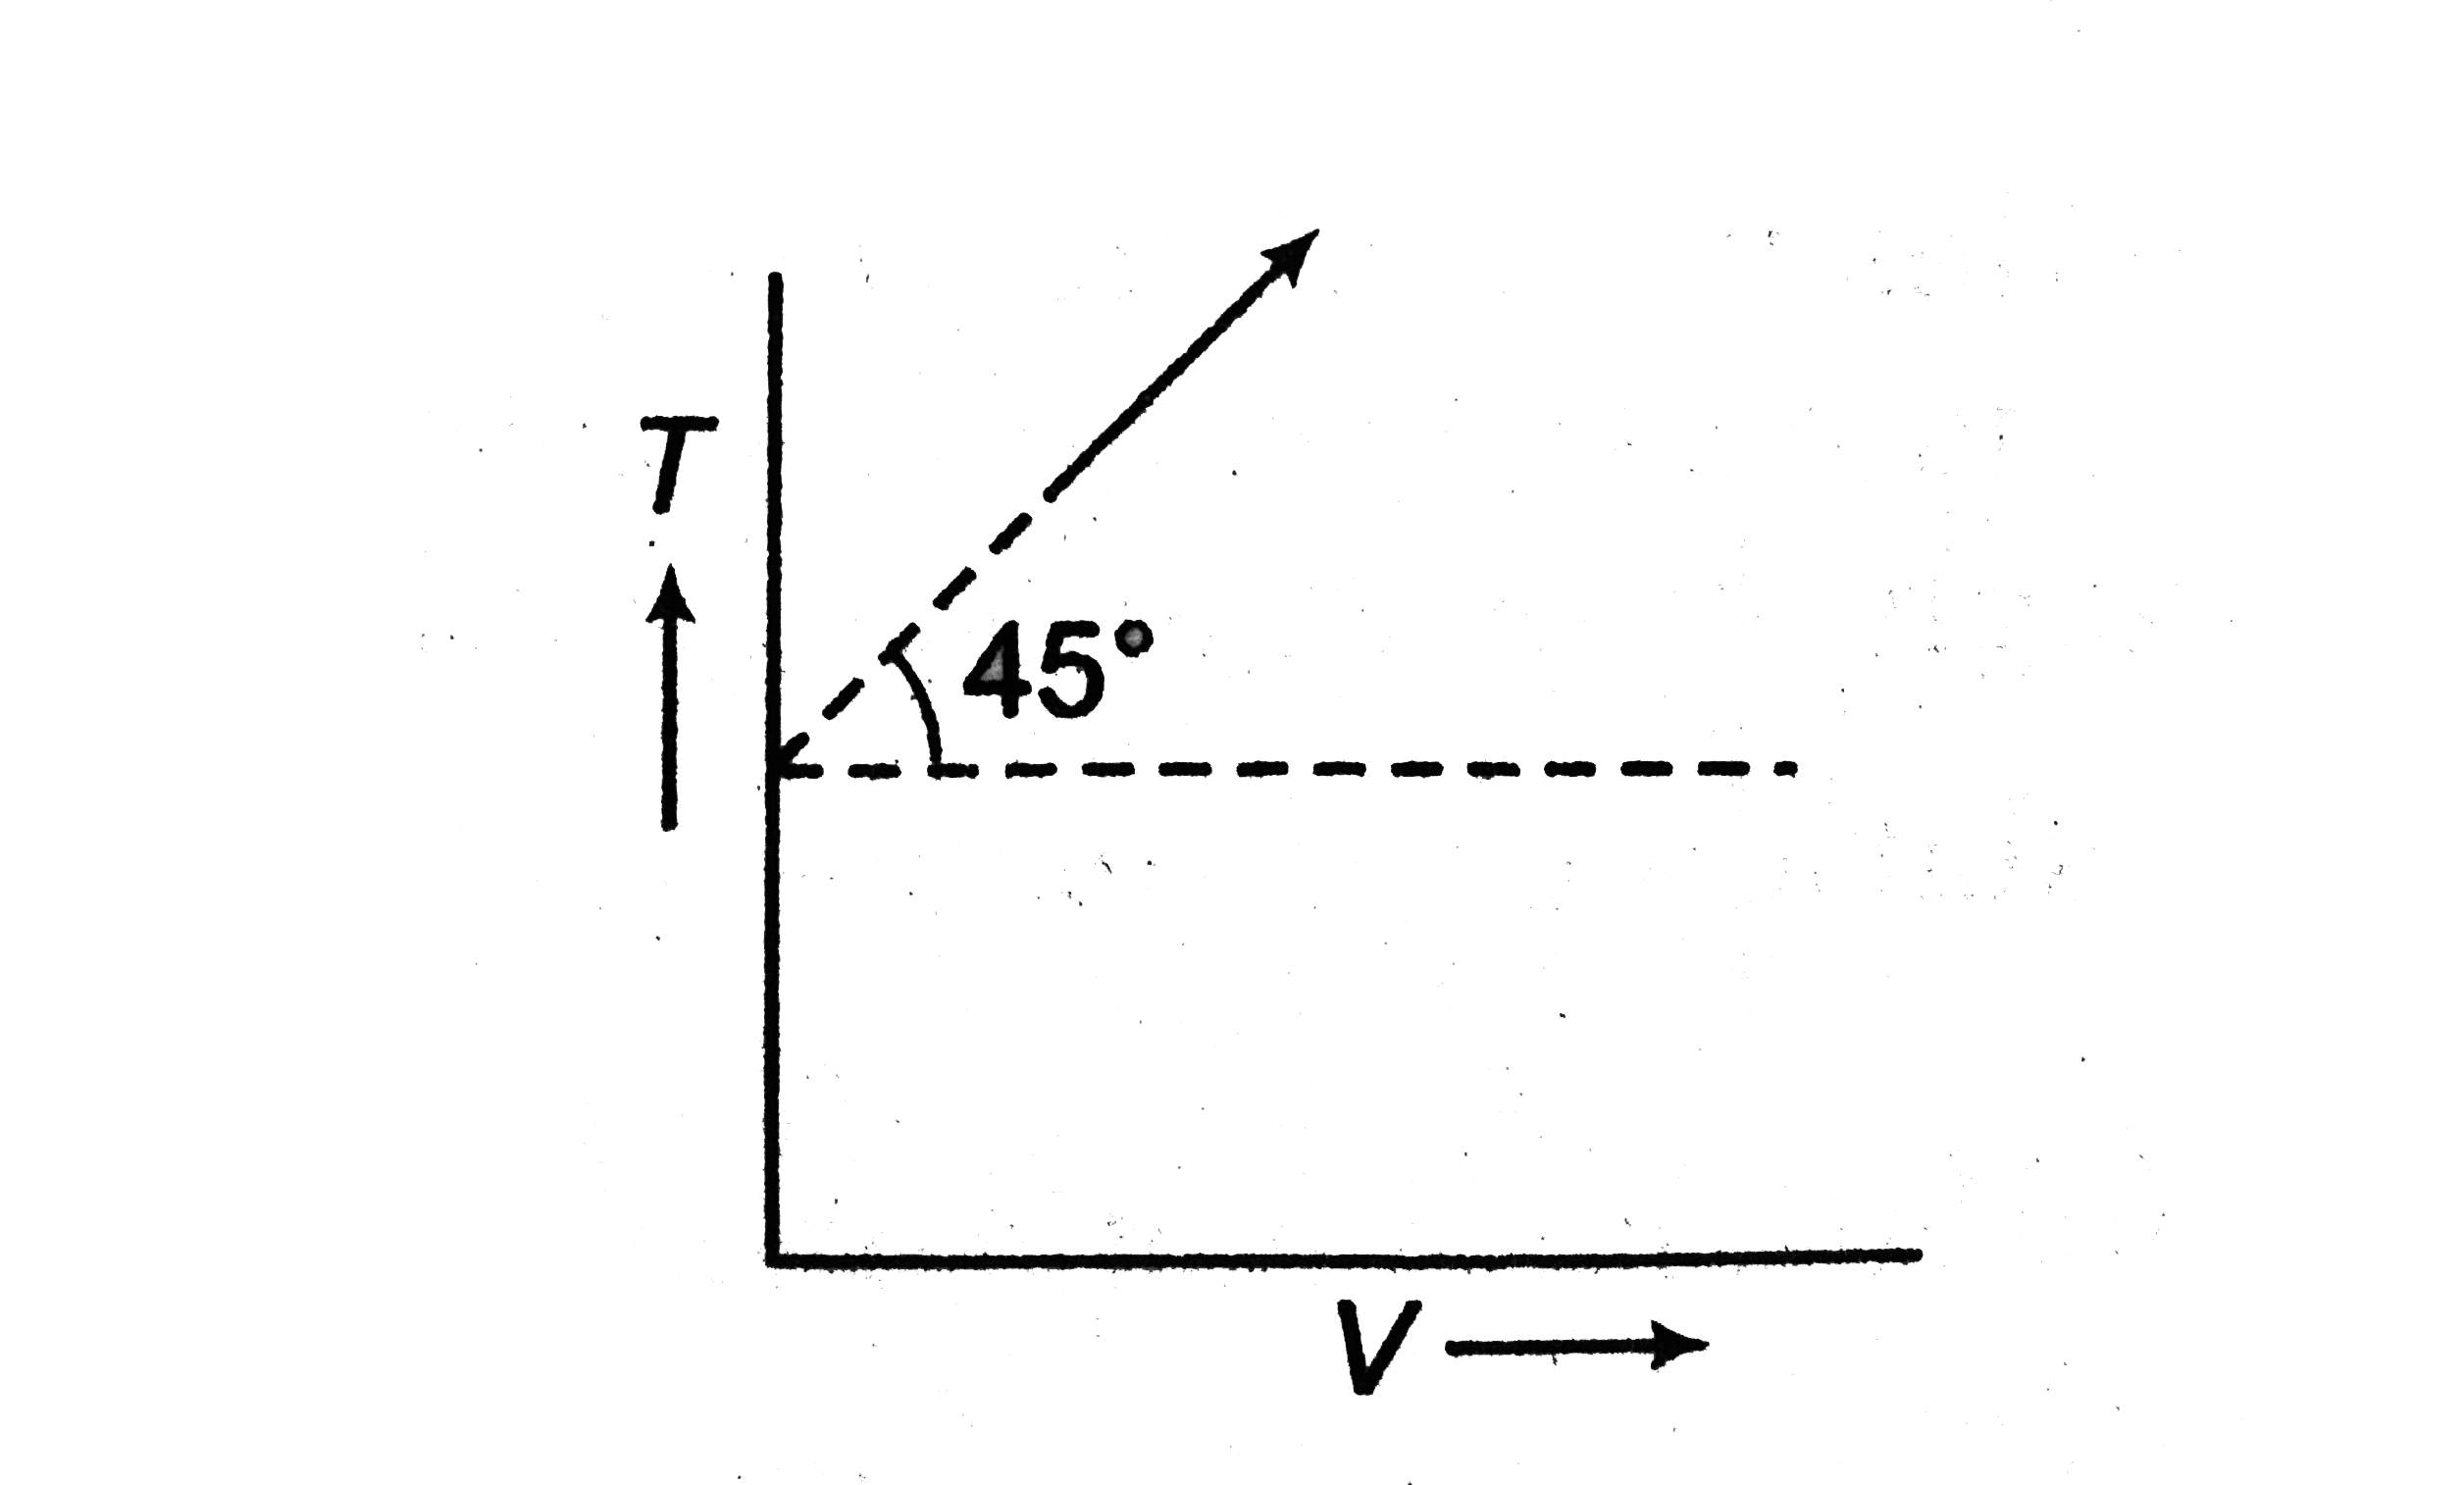
- The given curve represents the variation of temperatue as a function o...
Text Solution
|
- A gas is found to be obeyed the law p^2V = constant. The initial tempe...
Text Solution
|
- Air fills a rooms in winter at 7^@ C and in summer st 37^@ C. If the p...
Text Solution
|
- Three closed vessels A, B and C are at the same temperature T and cont...
Text Solution
|
- In a very good vacuum system in the laboratory, the vacuum attained wa...
Text Solution
|
- If nitrogen gas molecule goes straight up with its rms speed at 0^@ C ...
Text Solution
|
- The given (p - U) graph shows the variation of internal energy of an i...
Text Solution
|
- 28 g "of" N2 gas is contained in a flask at a pressure of 10 atm and a...
Text Solution
|
- A mixture of 4 g of hydrogen and 8 g of helium at (NTP) has a dencity ...
Text Solution
|
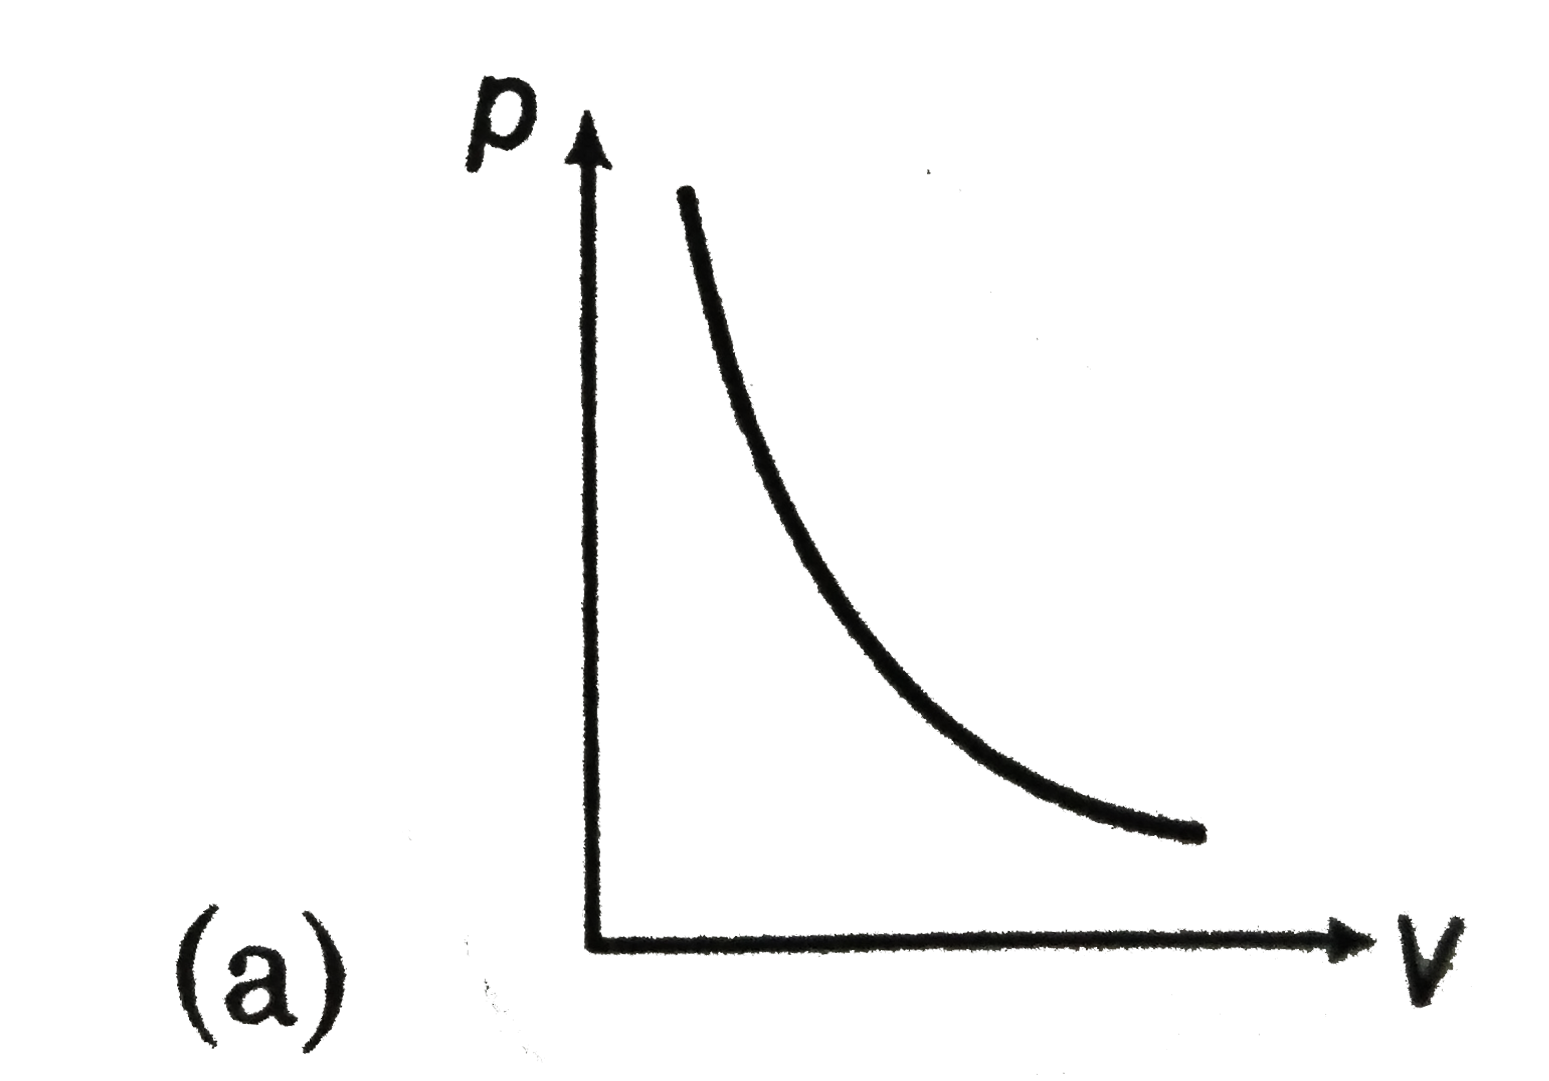
- The pressure (p) and the dencity rho of given mass of a gas expressed ...
Text Solution
|