A
B
C
D
Text Solution
Verified by Experts
The correct Answer is:


Similar Questions
Explore conceptually related problems
Recommended Questions
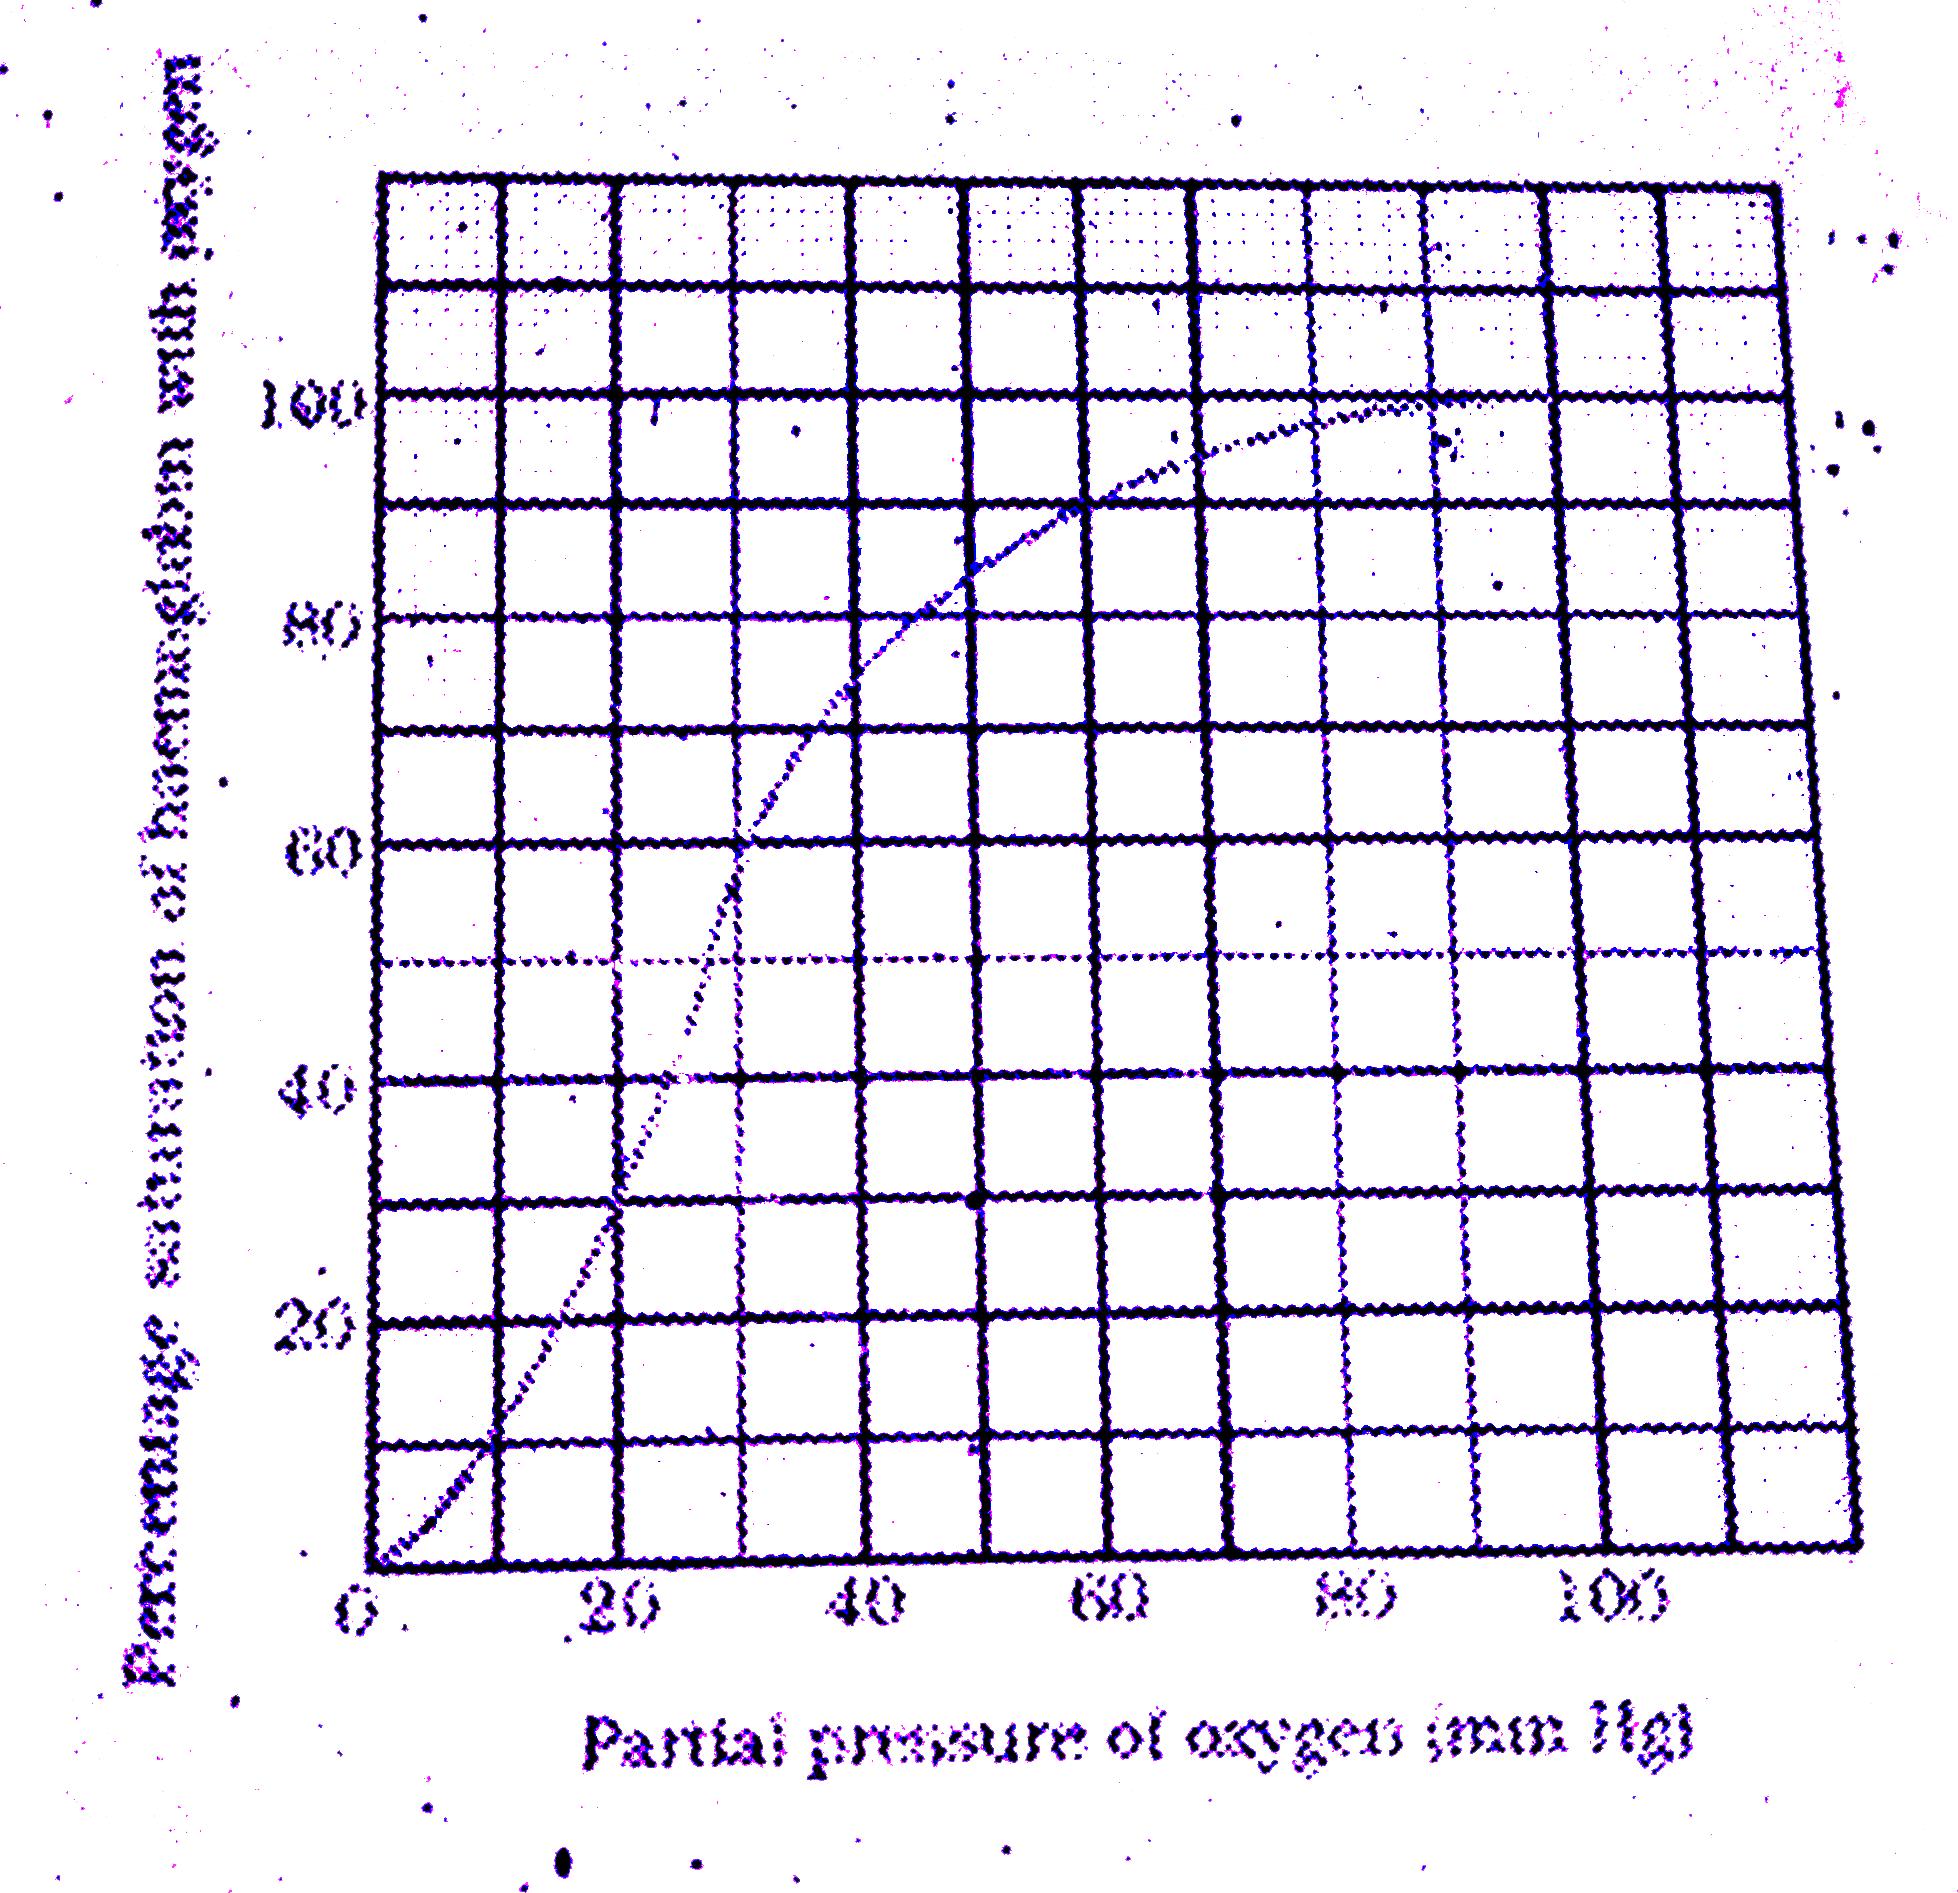
- O(2) dissociation curve is plotted between pO(2) and......
Text Solution
|
- Decrease in pH causes O(2) dissociation curve of . haemoglobin t6 shif...
Text Solution
|
- At higher O(2) concentration, oxygen dissociation curve of haemoglobin...
Text Solution
|
- O(2) dissociation curve is:
Text Solution
|
- O(2) dissociation curve is shifted to right in all except
Text Solution
|
- What is O(2) -dissociation curve ?
Text Solution
|
- What is the shape of O(2) dissociation curve for haemoglobin ?
Text Solution
|
- A graph is plotted between pO(2) and percentage saturation of Hb wit...
Text Solution
|
- When precentrage saturation of haemoglobin with O(2) is plotted agains...
Text Solution
|