Text Solution
Verified by Experts


Topper's Solved these Questions
STATES OF MATTER
CENGAGE CHEMISTRY|Exercise Exercises|21 VideosSTATES OF MATTER
CENGAGE CHEMISTRY|Exercise Exercises (Linked Comprehensive)|48 VideosSOME BASIC CONCEPTS AND MOLE CONCEPT
CENGAGE CHEMISTRY|Exercise Archives Subjective|11 VideosSTOICHIOMETRY
CENGAGE CHEMISTRY|Exercise Archives Subjective|33 Videos
Similar Questions
Explore conceptually related problems
CENGAGE CHEMISTRY-STATES OF MATTER-Exercises (Ture False)
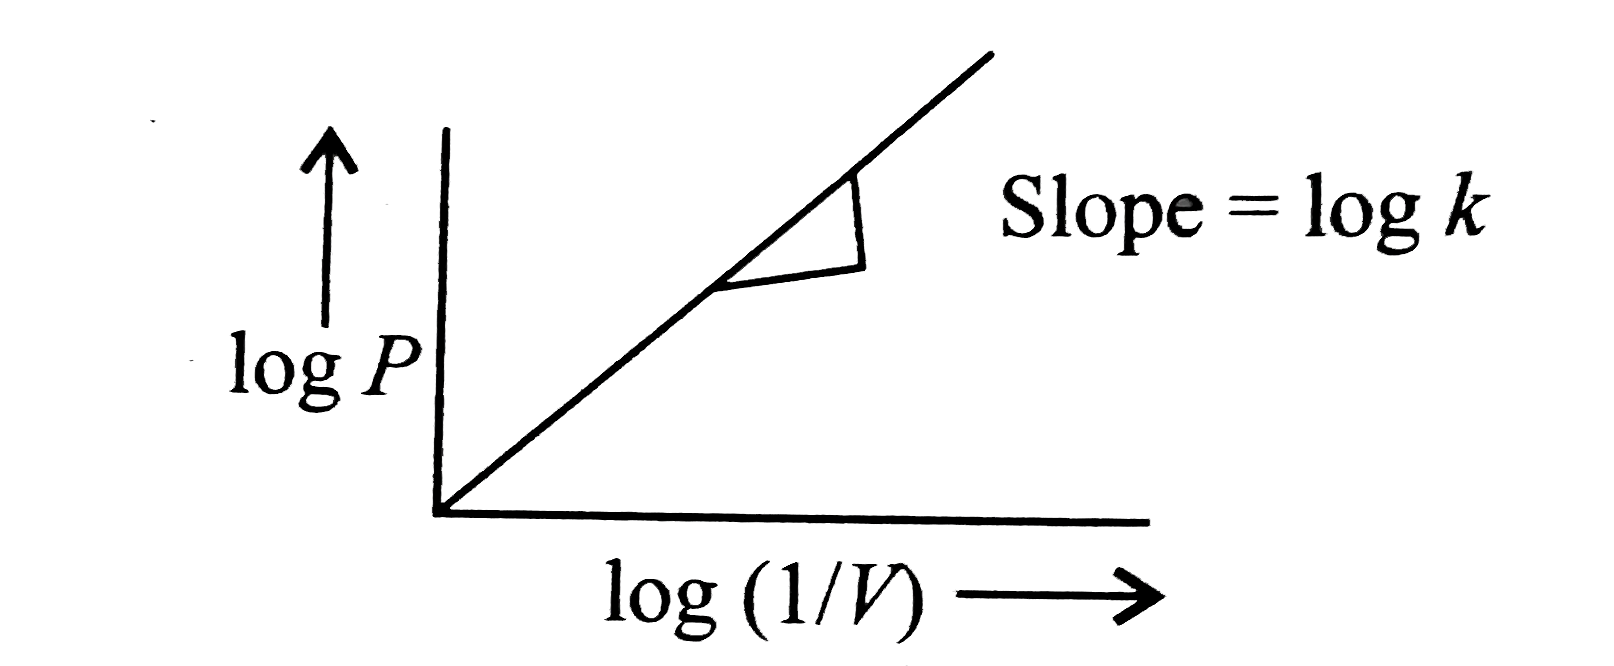
- Draw a graph of log P and log (1//V) for a fixed amount of gas at cons...
Text Solution
|
- In the van der Waals equation (P + (n^(2)a)/(V^(2)))(V - nb) = nRT ...
Text Solution
|
- Kinetic energy of a molecule is zero at 0^(@)C
Text Solution
|
- A gas in a closed container will exert much higher pressure due to gra...
Text Solution
|
- The graph between PV vs P at constant temperature is linear parallel t...
Text Solution
|
- Real gases show deviation from ideal behaviour at low temperature and ...
Text Solution
|
- In the microscopic model of the gas, all the moleculer are supposed to...
Text Solution
|
- For real gases, at high temperature Z = 0 small value of a means gas...
Text Solution
|
- Small value of a means, gas can be easily liqueifed.
Text Solution
|
- Rate of diffusion is directly proportional to the square root of molec...
Text Solution
|
- For ideal gases, Z = 1 at all temperature and pressure.
Text Solution
|
- According to charles's law,
Text Solution
|
- The pressure of moist gas is higher than pressure of dry gas.
Text Solution
|
- Gases do not occupy volume and do not have force of attraction.
Text Solution
|
- The van der Waal equation of gas is (P + (n^(2)a)/(V^(2))) (V - nb)...
Text Solution
|
- Surface tension and surface energy have different dimensions.
Text Solution
|
- The plot of PV vs P at particular temperature is called isovbar.
Text Solution
|
- Equal volume of all gases always contains equal number of moles.
Text Solution
|
- A gas with a = 0 cannot be liquified.
Text Solution
|
- The van der waals constants have same values for all the gases.
Text Solution
|
- All the molecules in a given sample of gas move with same speed.
Text Solution
|