


Similar Questions
Explore conceptually related problems
Recommended Questions
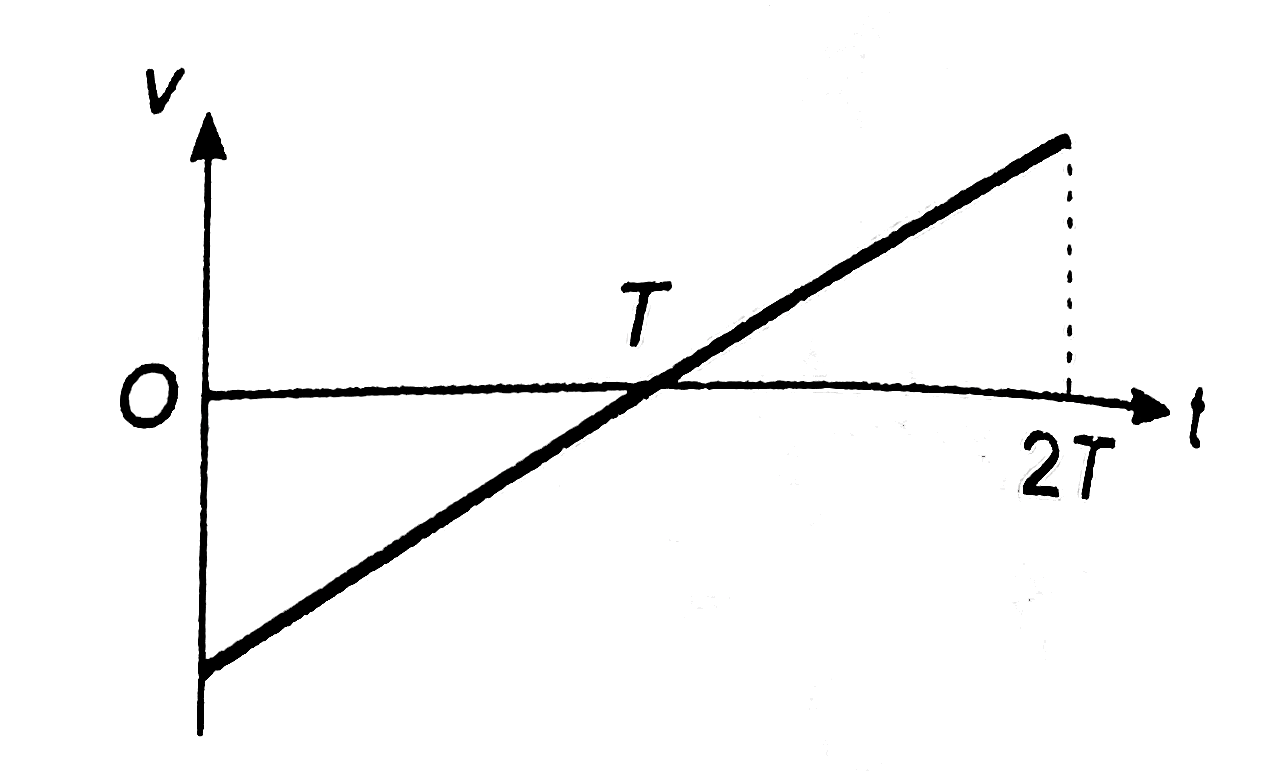
- The figure shows the velocity (v) of a particle plotted against time (...
Text Solution
|
- The velocity time plot for a particle moving on straight line is show...
Text Solution
|
- The figure shows the velocity (v) of a particle plotted against time (...
Text Solution
|
- Figure shows the velocity time graph of a particle moving along straig...
Text Solution
|
- The figure shows the velocity (v) of a particle ploted against time (t...
Text Solution
|
- The force F acting on a particle plotted against time t is shown in fi...
Text Solution
|
- The velocity-time plot for a particle moving on a straight line is sho...
Text Solution
|
- The velocity -time (v - t) graph of a particle moving in a straight li...
Text Solution
|
- If velocity v varies with time(t) as v=2t-3, then the plot between v a...
Text Solution
|