A
B
C
D
Text Solution
Verified by Experts


Topper's Solved these Questions
CHEMICAL EQUILIBRIUM
CENGAGE CHEMISTRY|Exercise Concept Applicationexercise 7.1|53 VideosCHEMICAL EQUILIBRIUM
CENGAGE CHEMISTRY|Exercise Ex 7.2|40 VideosCHEMICAL BONDING AND MOLECULAR STRUCTURE
CENGAGE CHEMISTRY|Exercise Archives Subjective|15 VideosCLASSIFICATION AND NOMENCLATURE OF ORGANIC COMPOUNDS
CENGAGE CHEMISTRY|Exercise Analytical and Descriptive Type|3 Videos
Similar Questions
Explore conceptually related problems
CENGAGE CHEMISTRY-CHEMICAL EQUILIBRIUM-Archives (Subjective)
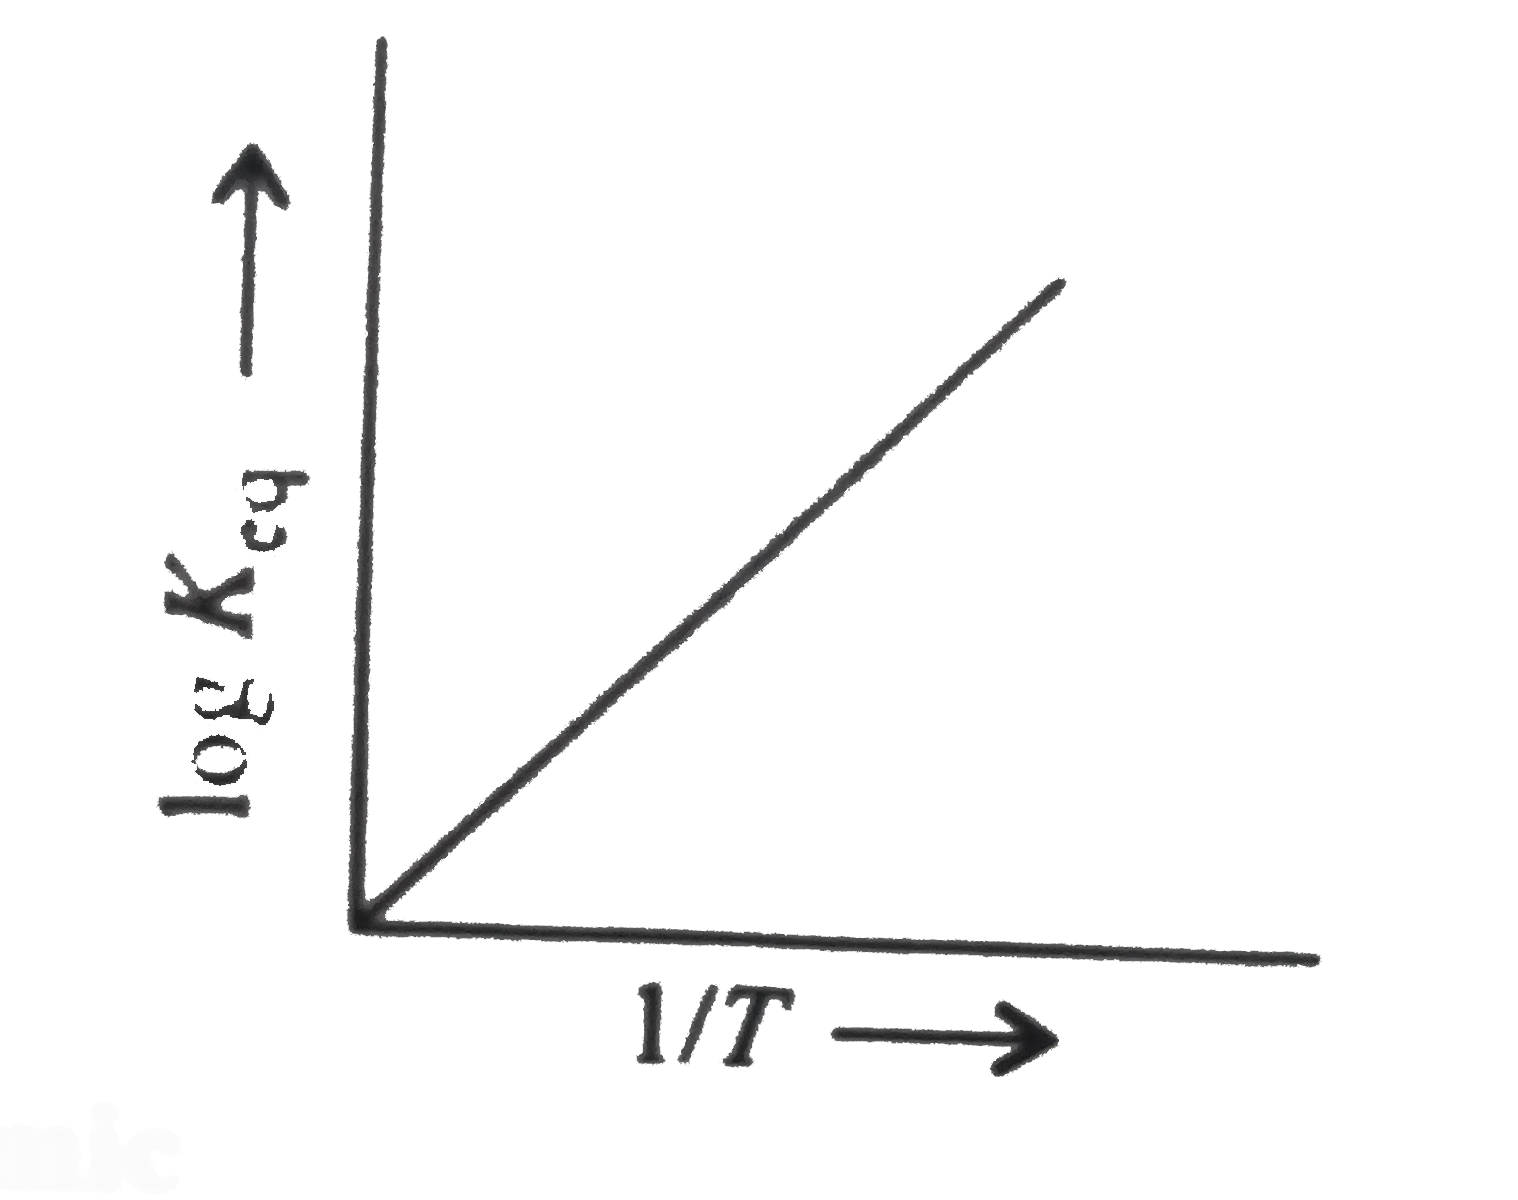
- A schematic plot of log K(eq) vs inverse of temperature for a reaction...
Text Solution
|
- 1 mol of nitrogen is mixed with 3 mol of hydrogen in a 4 L container. ...
Text Solution
|
- 1mol of N(2) and 3 mol of PCl(5) are placed in a 100 L vessel heated t...
Text Solution
|
- The equilibrium constant of the reaction A(2)(g)+B(2)(g) hArr 2AB(g)...
Text Solution
|
- At a certain temperature, equilibrium constant (K(c)) is 16 for the re...
Text Solution
|
- N(2)O(4) is 25% dissociated at 37^(@)C and 1 atm. Calculate (i) K(p) a...
Text Solution
|
- For the reaction CO(g)+2H(2)(g) hArr CH(3)OH(g) hydrogen gas is in...
Text Solution
|
- When 0.15 mol of CO taken in a 2.5 L flask is maintained at 750 K alon...
Text Solution
|
- The progress of the reaction A hArr nB with time is persented in the f...
Text Solution
|
- The degree of dissociation is 0.4 at 400 K and 1.0 atm for the gaseous...
Text Solution
|
- When 3.06 g of solid NH(4)HS is intoduced into a 2-L evacuated flask a...
Text Solution
|
- In the reaction equilibrium N(2)O(4) hArr 2NO(2)(g) When 5 mol of ...
Text Solution
|