A
B
C
D
Text Solution
Verified by Experts
The correct Answer is:


Topper's Solved these Questions
CHEMICAL KINETICS
CENGAGE CHEMISTRY|Exercise Exercises Assertion-Reasoning|22 VideosCHEMICAL KINETICS
CENGAGE CHEMISTRY|Exercise Exercises Integer|15 VideosCHEMICAL KINETICS
CENGAGE CHEMISTRY|Exercise Exercises Multiple Correct|34 VideosCARBOXYLIC ACIDS AND THEIR DERIVATIVES
CENGAGE CHEMISTRY|Exercise Exercises Archives (Analytical And Descriptive)|34 VideosCOORDINATION COMPOUNDS
CENGAGE CHEMISTRY|Exercise Archives Subjective|18 Videos
Similar Questions
Explore conceptually related problems
CENGAGE CHEMISTRY-CHEMICAL KINETICS-Exercises Single Correct
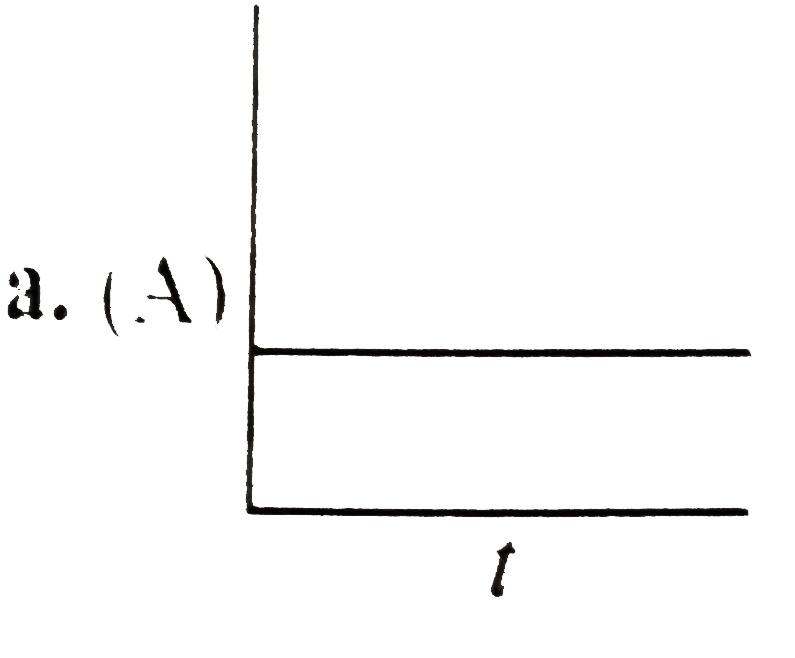
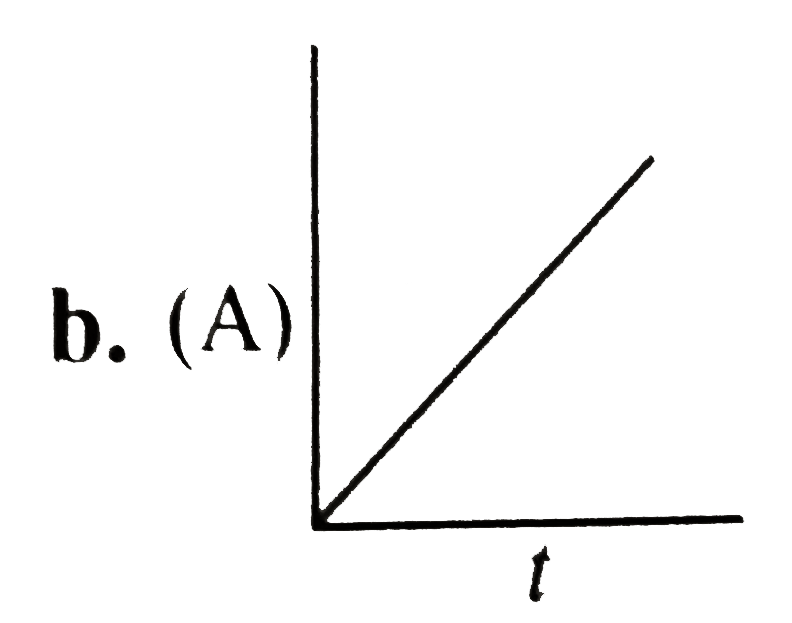
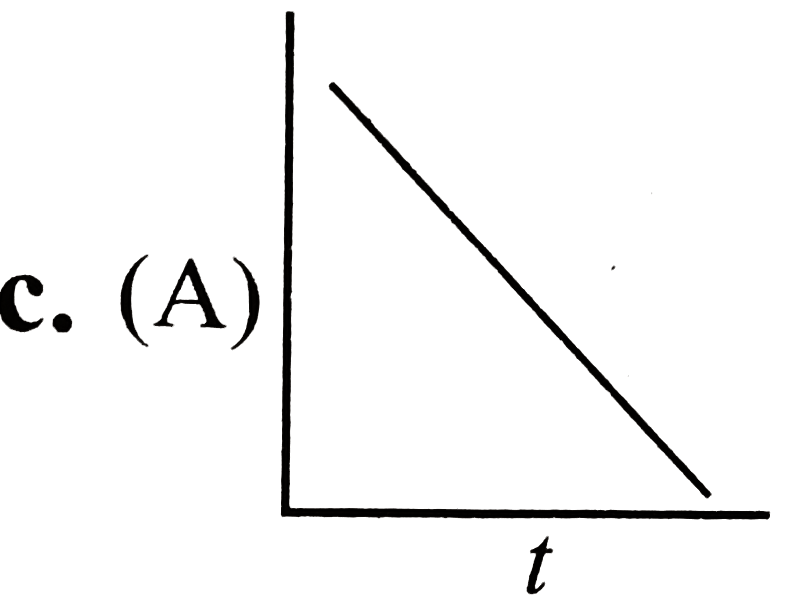
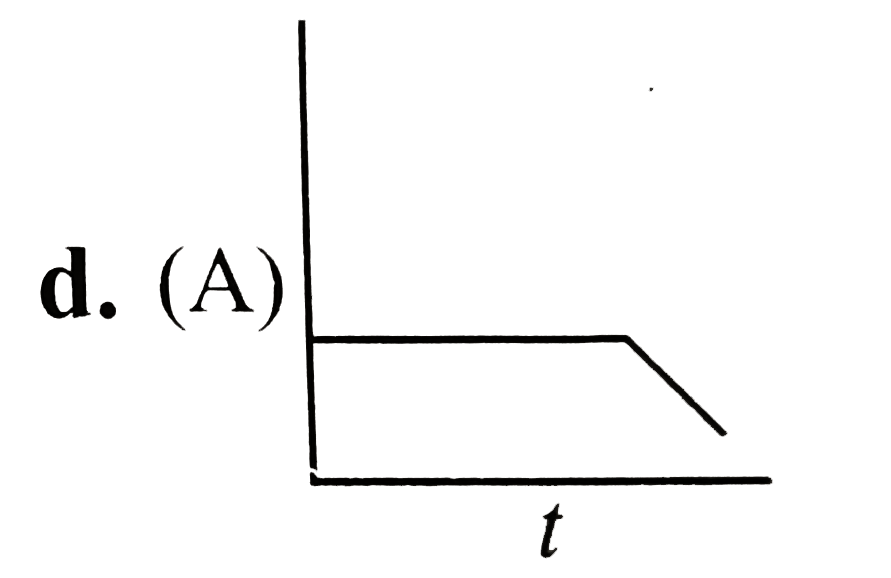
- The accompanying figure depicts a change in concentration of species A...
Text Solution
|
- Which of the following is correct graph for the reaction?
Text Solution
|
- Which of the following graphs represents zero order if A rarr P At...
Text Solution
|
- Which of the following expresisons give the effect of temperature on t...
Text Solution
|
- The plot og log k vs 1//T helps to calculate
Text Solution
|
- For a first order reaction t(0.75) is 1386 s. Therefore, the specific ...
Text Solution
|
- In a first order reaction, the concentration of the reactant decreases...
Text Solution
|
- The rate equation for the reaction 2A+B rarr C is found to be: rate = ...
Text Solution
|
- A graph plotted between log k versus 1//T for calculating activation e...
Text Solution
|
- The potential energy diagram for a reaction R rarr P is given below. D...
Text Solution
|
- The activation energy for a ismple chemical reaction A rarr B is E(a) ...
Text Solution
|
- The reaction Ararr B follows first order kinetics. The time taken for ...
Text Solution
|
- The quantum yield of photosyntheiss of
Text Solution
|
- When the rate determined by the change in concentration of two differe...
Text Solution
|
- The slope of the line graph of log k versus 1//T for the reaction N(2)...
Text Solution
|
- The inverison of a sugar follows first order rate equation which can b...
Text Solution
|
- For a certain decompoistion, the rate is 0.30 M s^(-1) when the concen...
Text Solution
|
- For a second order reaction dx//dt =k(a-x)^(2). Its half life periof ...
Text Solution
|
- The activation energy of reactant molecules in a reaction depends upon
Text Solution
|
- The dissociation of nitrogen pentaoxide is a first order reaction. In ...
Text Solution
|