Text Solution
Verified by Experts


Topper's Solved these Questions
CHALLENGING QUESTIONS
NAVNEET PUBLICATION - MAHARASHTRA BOARD|Exercise EXAMPLE FOR PRACTICE|22 VideosBOARD'S QUESTION PAPER : MARCH 2019
NAVNEET PUBLICATION - MAHARASHTRA BOARD|Exercise QUESTION|30 VideosCHALLENGING QUESTIONS
NAVNEET PUBLICATION - MAHARASHTRA BOARD|Exercise SECTION 3 (MODEL QUESTION PAPER FOR PRACTICE ) Solve any one of the following subquestions :|1 Videos
Similar Questions
Explore conceptually related problems
NAVNEET PUBLICATION - MAHARASHTRA BOARD-CHALLENGING QUESTIONS -EXAMPLE FOR PRACTICE
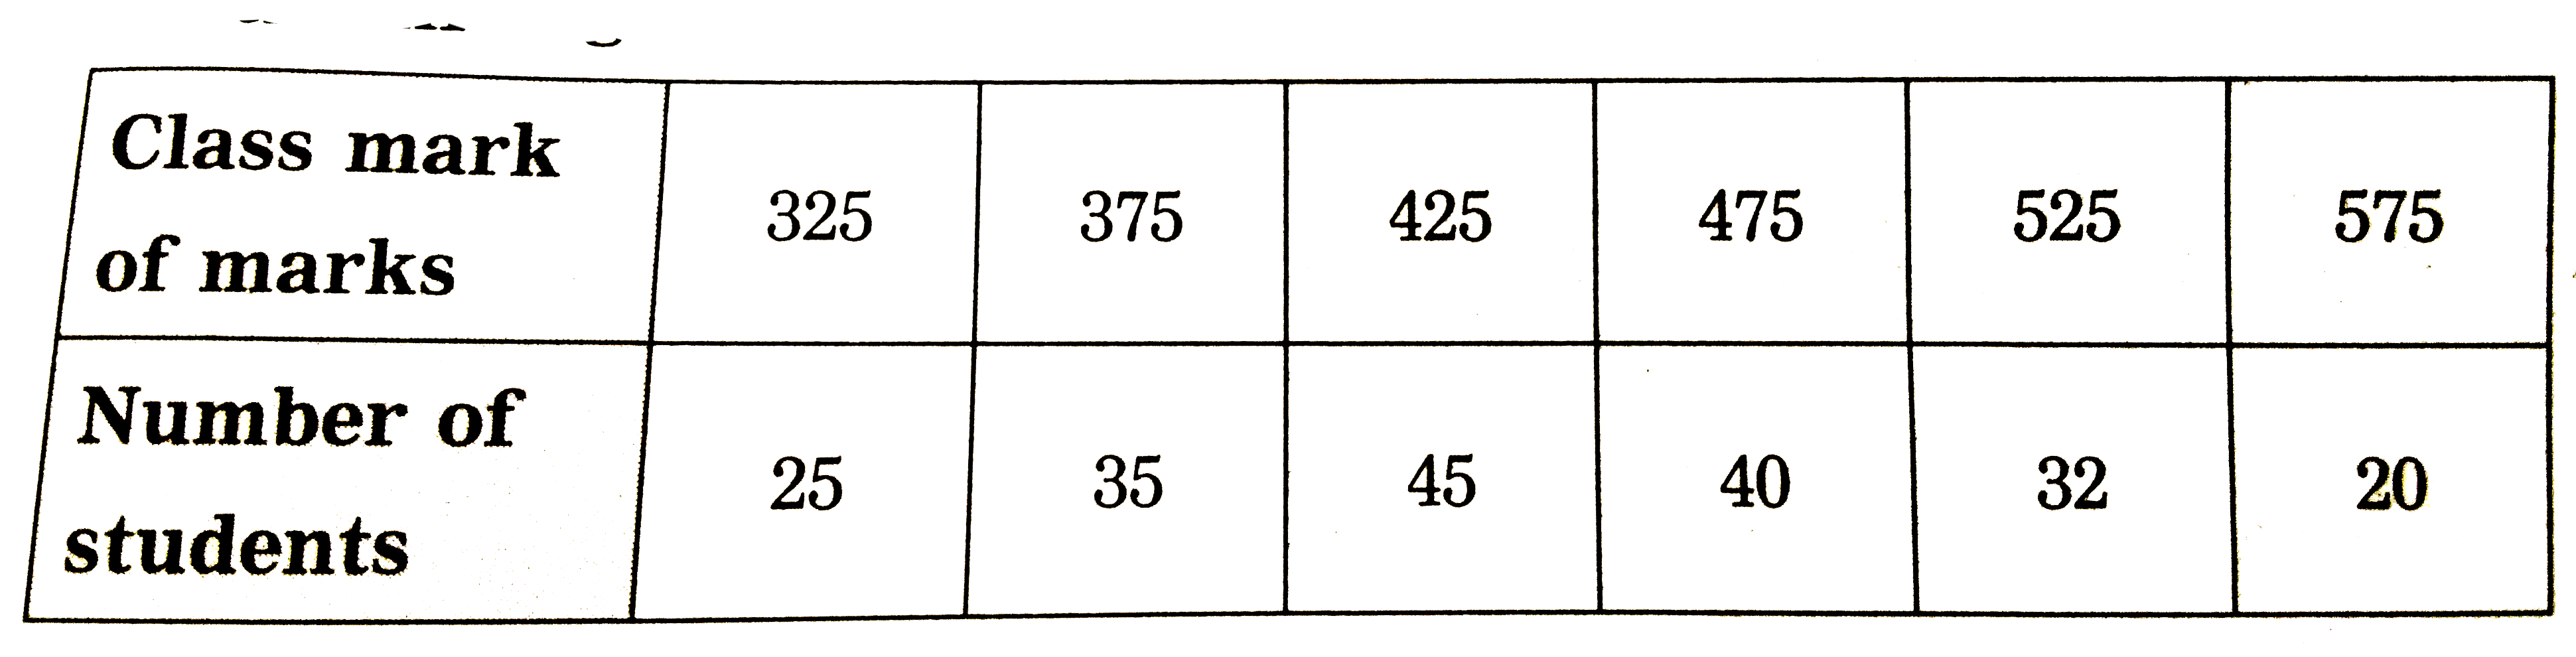
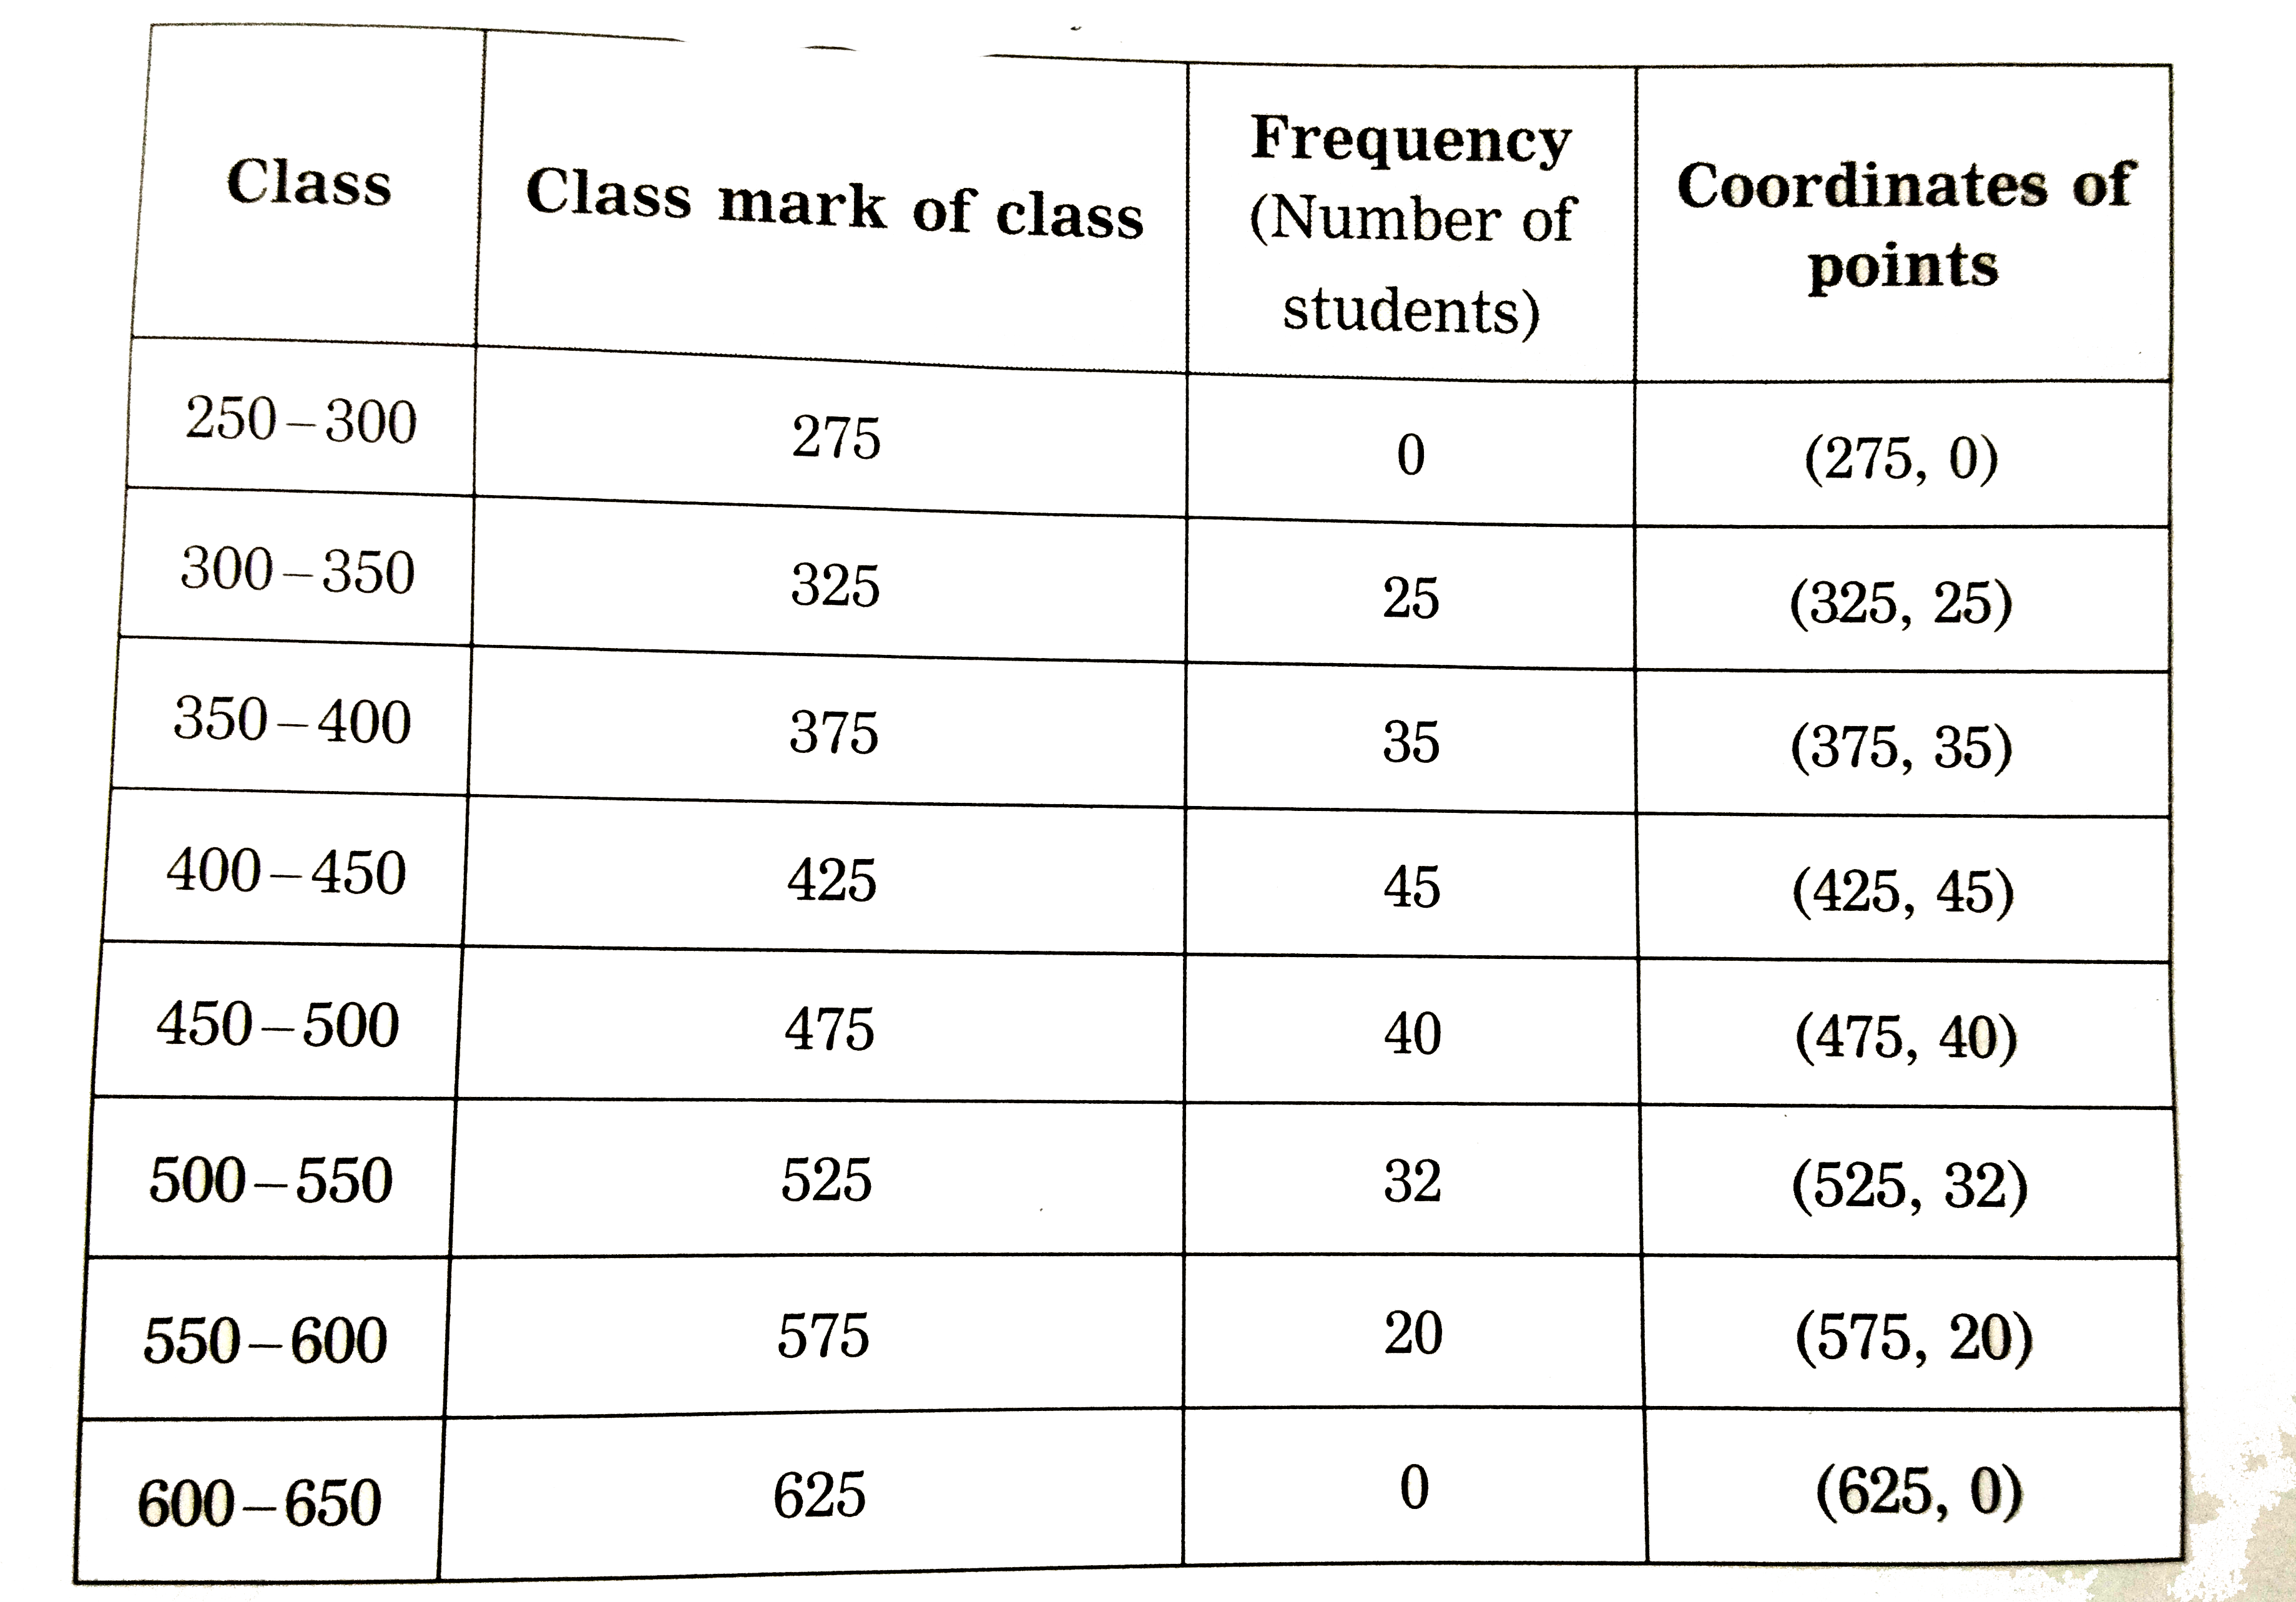
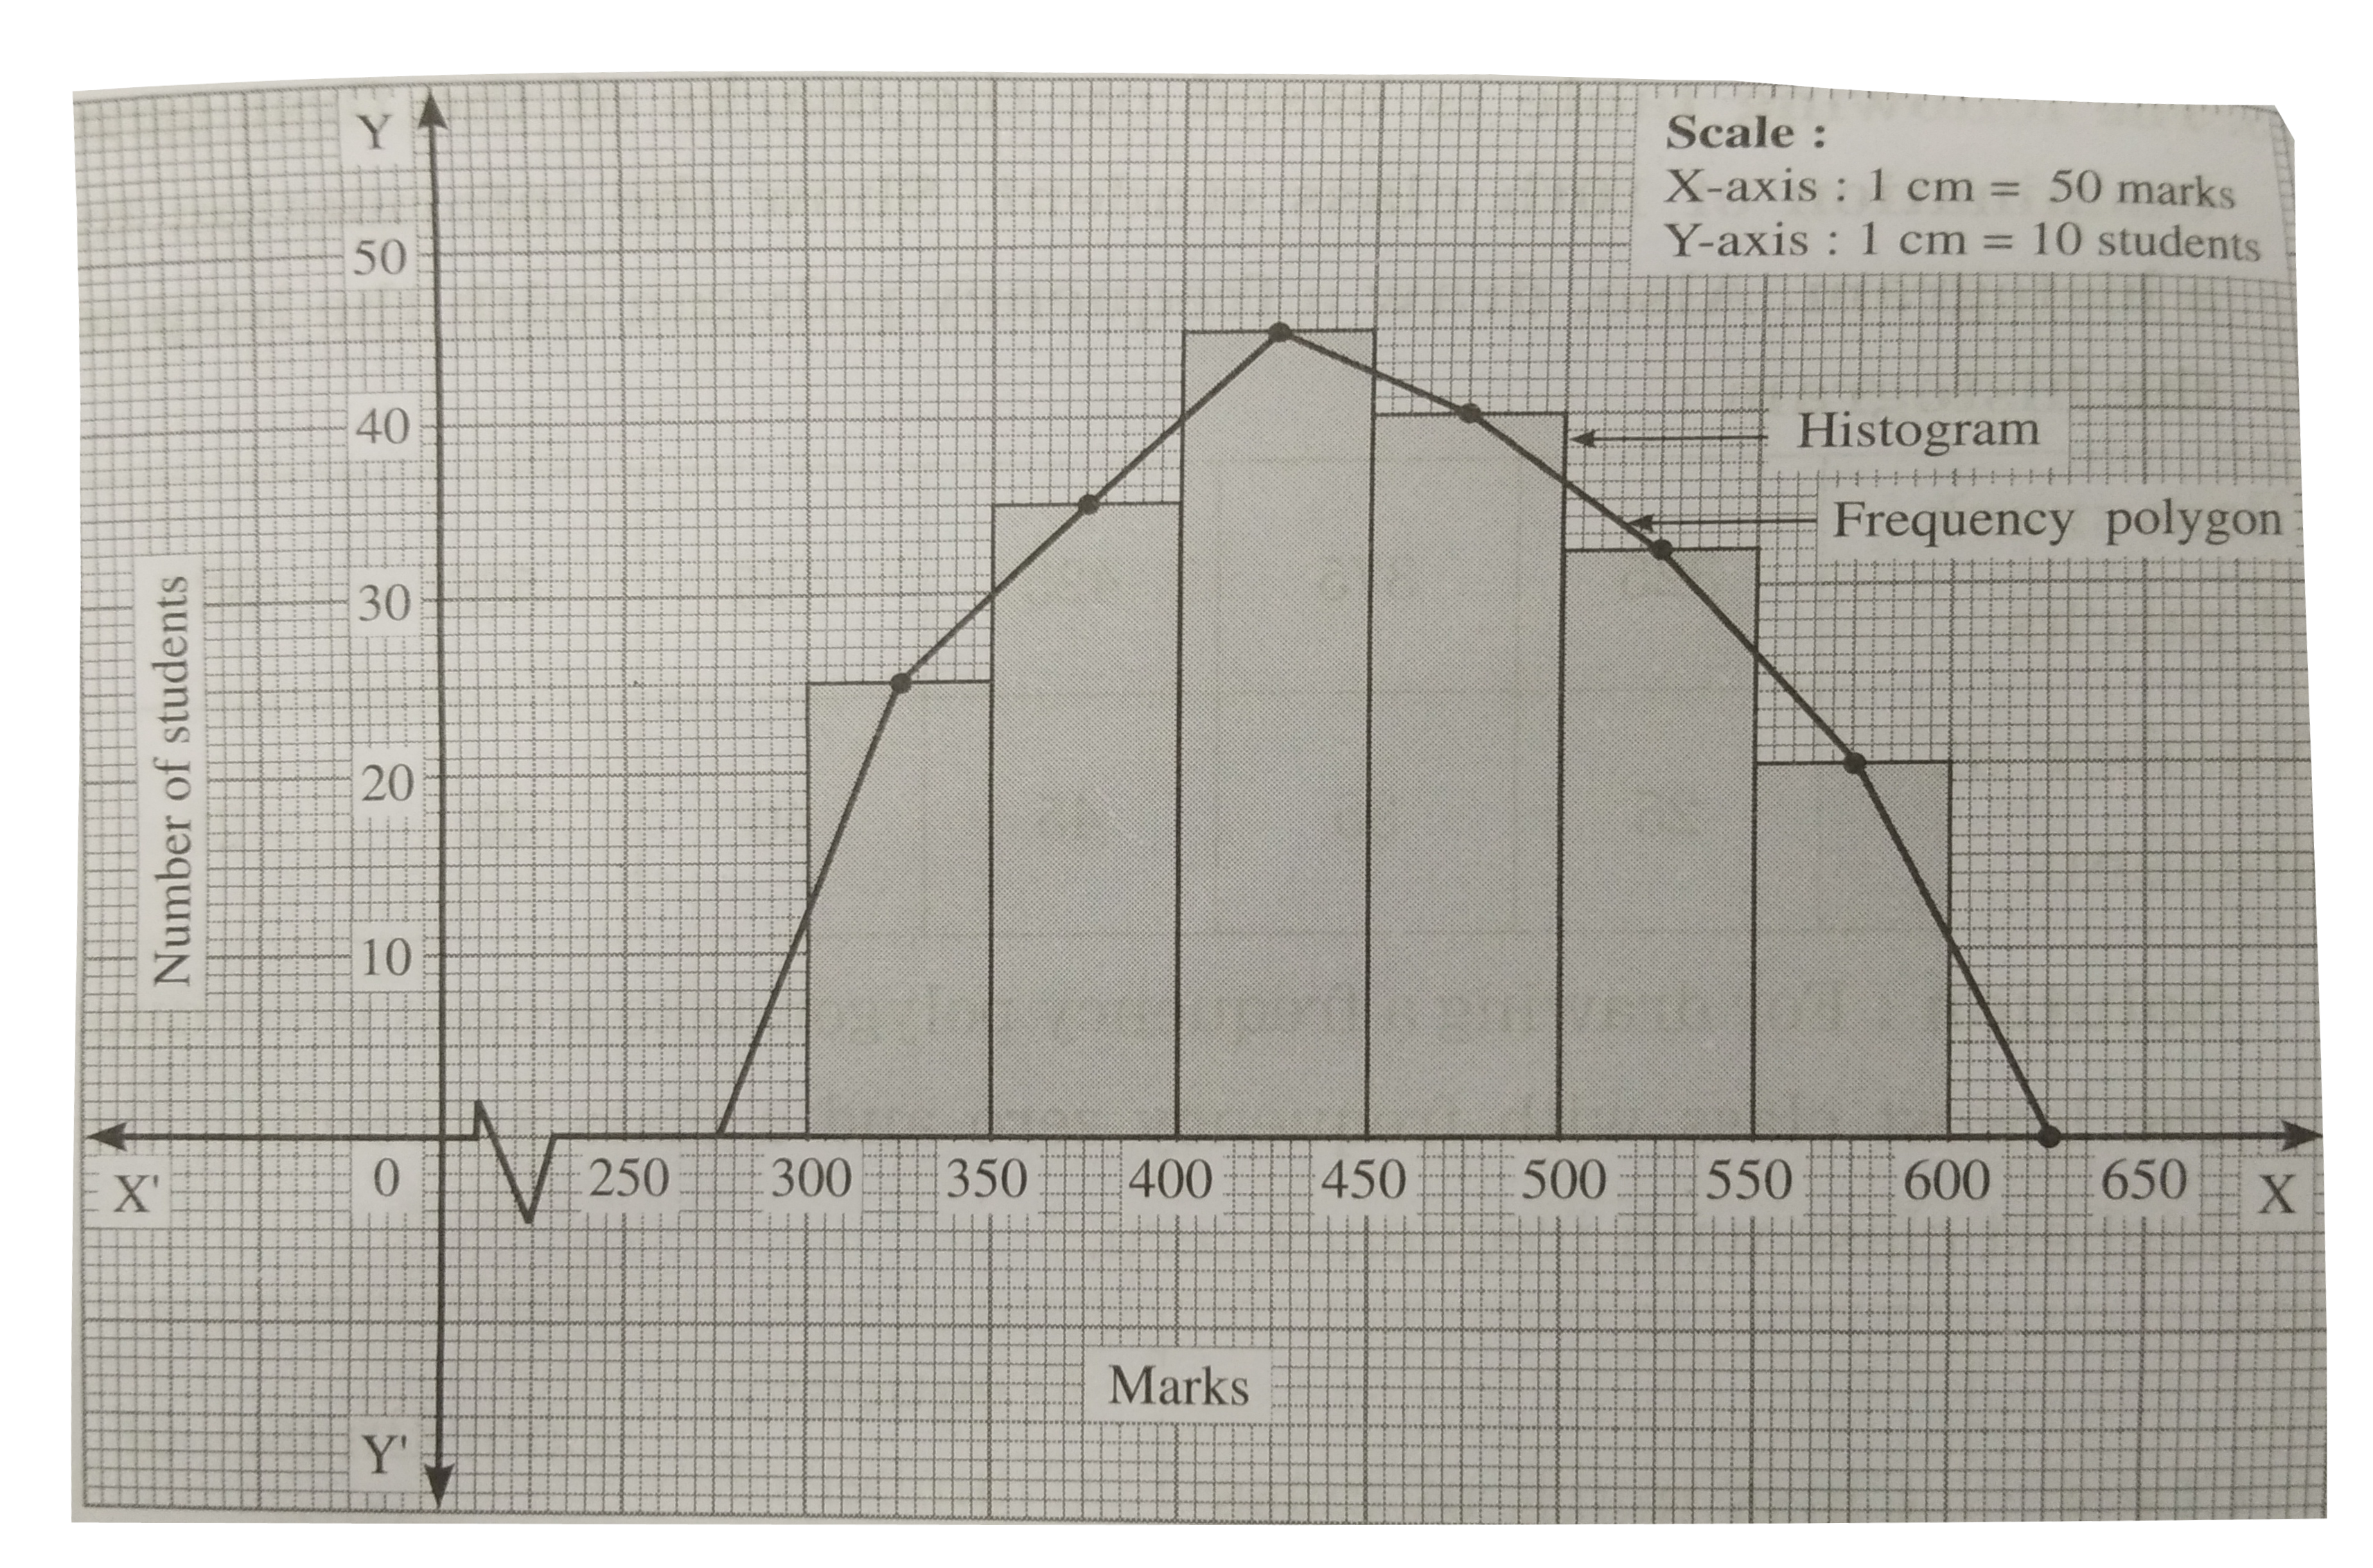
- The following table is based on the marks of the first term examinatio...
Text Solution
|
- Solve: (i) 8/(x+2y)+3/(2x-y)=3,12/(x+2y)-6/(2x-y)=1. (ii) 2/(x-1)+...
Text Solution
|
- Solve the the simultaneous equations 2x+y=6,(4-3x)/4=y graphically.
Text Solution
|
- Anil is older than his friend Baiju by 3 years. Anil's father is thric...
Text Solution
|
- If the sum of the roots of the quadratic equation ax^(2)+bx+c=0 is equ...
Text Solution
|
- An exterior angle of a regular polygon having n sides is more than tha...
Text Solution
|
- Find the common difference of an A.P. whose first term is 5 and the su...
Text Solution
|
- In April 2018, the number of visitors to Antartica to see penguins inc...
Text Solution
|
- Rs. 5000 is deposited at 6% simple interest. Check, if the interest am...
Text Solution
|
- If p th term of an A.P. is 1/q and q th term is 1/p prove that the sum...
Text Solution
|
- Sandeep Electronics purchased ceiling fans for Rs. 50,176 (with GST) a...
Text Solution
|
- Manoj purchased 70 shares at MV Rs. 125. he sold half of the shares at...
Text Solution
|
- Two-digit numbers are formed from the digits 0,1,2,3,4 where repetitio...
Text Solution
|
- There are 3 boys and 2 girls. A Plant More Trees committee of two is t...
Text Solution
|
- A coin is tossed and a die is rolled simultaneously. (i) P is the ev...
Text Solution
|
- The 6th term of an A.P. is zero. Prove that its 21st term is triple it...
Text Solution
|
- The following table shows the number of patients of differents age gro...
Text Solution
|
- Among the group of students 10% scored marks below 20, 20% scored mark...
Text Solution
|
- The pie diagram shows the classification of skilled workers. If the ...
Text Solution
|
- The median of the following dats is 52.5. If the total frequency is 10...
Text Solution
|
- The frequency distribution of daily wages of 130 workers is given belo...
Text Solution
|