To solve the problem of plotting the magnitude of the magnetic field \( \vec{B} \) versus the distance \( r \) from the center of a wire with radius \( R \) carrying a current \( I \), we can follow these steps:
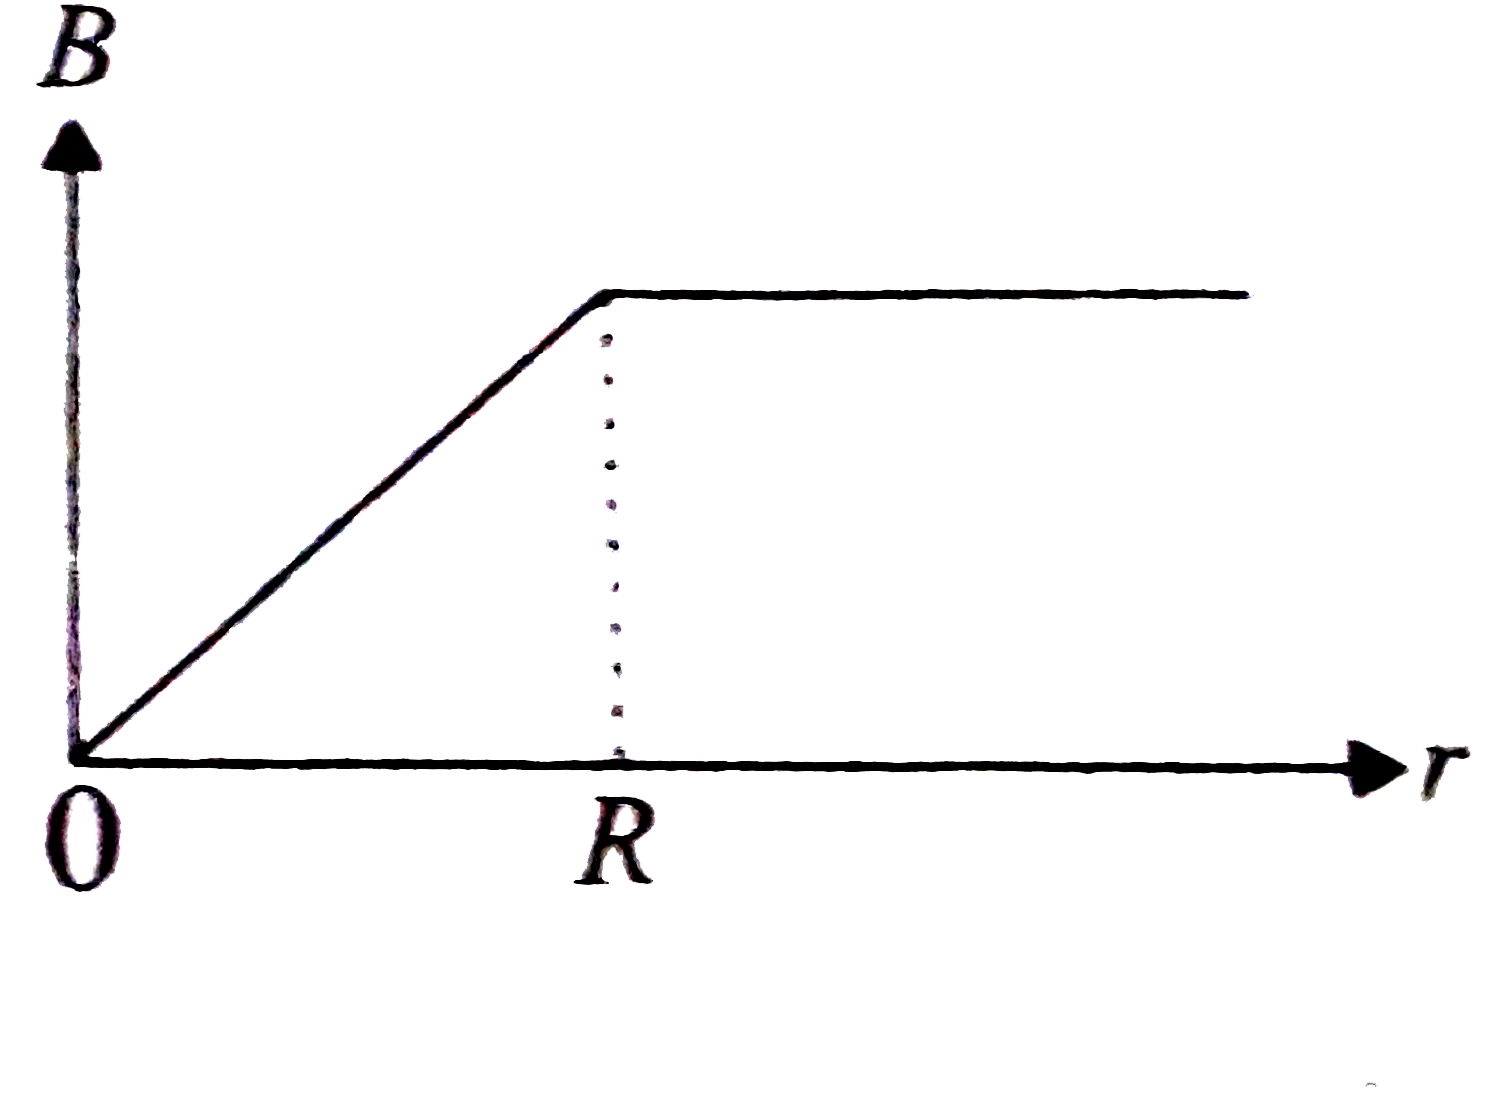
### Step 1: Understanding the Magnetic Field Inside the Wire
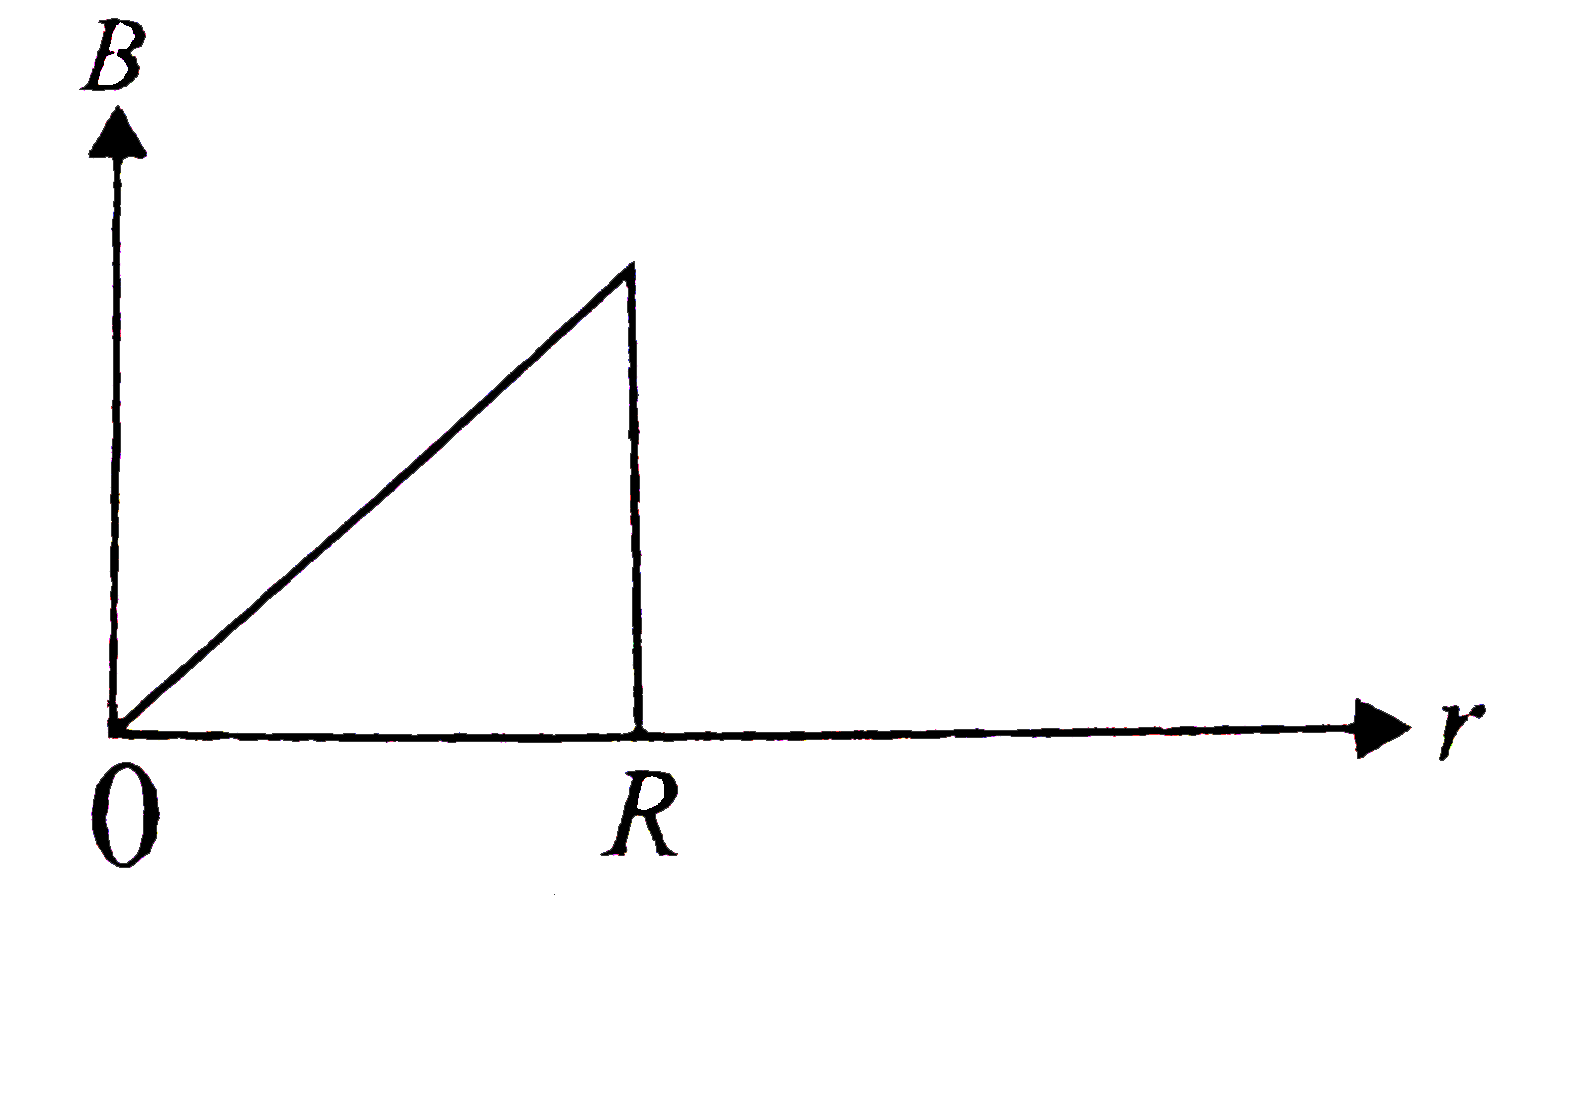
When we are inside the wire (i.e., \( r < R \)), the magnetic field \( B \) can be determined using Ampere's Law. For a uniformly current-carrying wire, the magnetic field inside the wire increases linearly with the distance from the center. The formula for the magnetic field inside the wire is given by:
\[
B = \frac{\mu_0 I r}{2 \pi R^2}
\]
where \( \mu_0 \) is the permeability of free space, \( I \) is the current flowing through the wire, \( r \) is the distance from the center, and \( R \) is the radius of the wire.
### Step 2: Understanding the Magnetic Field at the Surface of the Wire
At the surface of the wire (i.e., when \( r = R \)), the magnetic field can be calculated using the formula:
\[
B = \frac{\mu_0 I}{2 \pi R}
\]
This represents the maximum value of the magnetic field inside the wire.
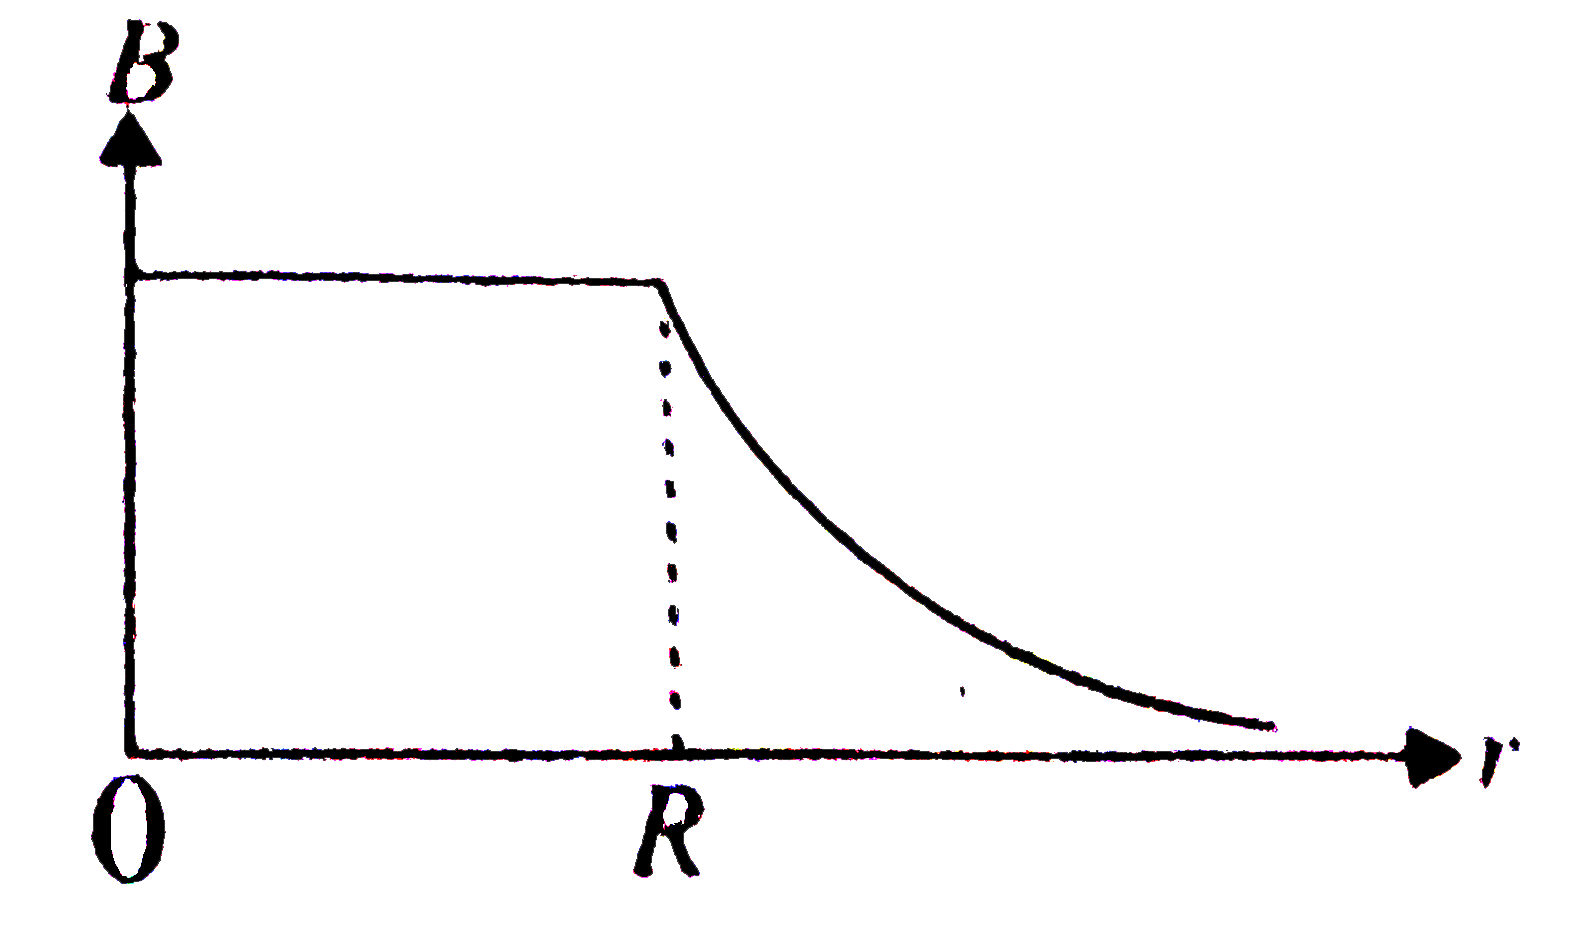
### Step 3: Understanding the Magnetic Field Outside the Wire
When we are outside the wire (i.e., \( r > R \)), the magnetic field decreases with the distance from the center of the wire. The formula for the magnetic field outside the wire is:
\[
B = \frac{\mu_0 I}{2 \pi r}
\]
This shows that the magnetic field is inversely proportional to the distance from the center of the wire.
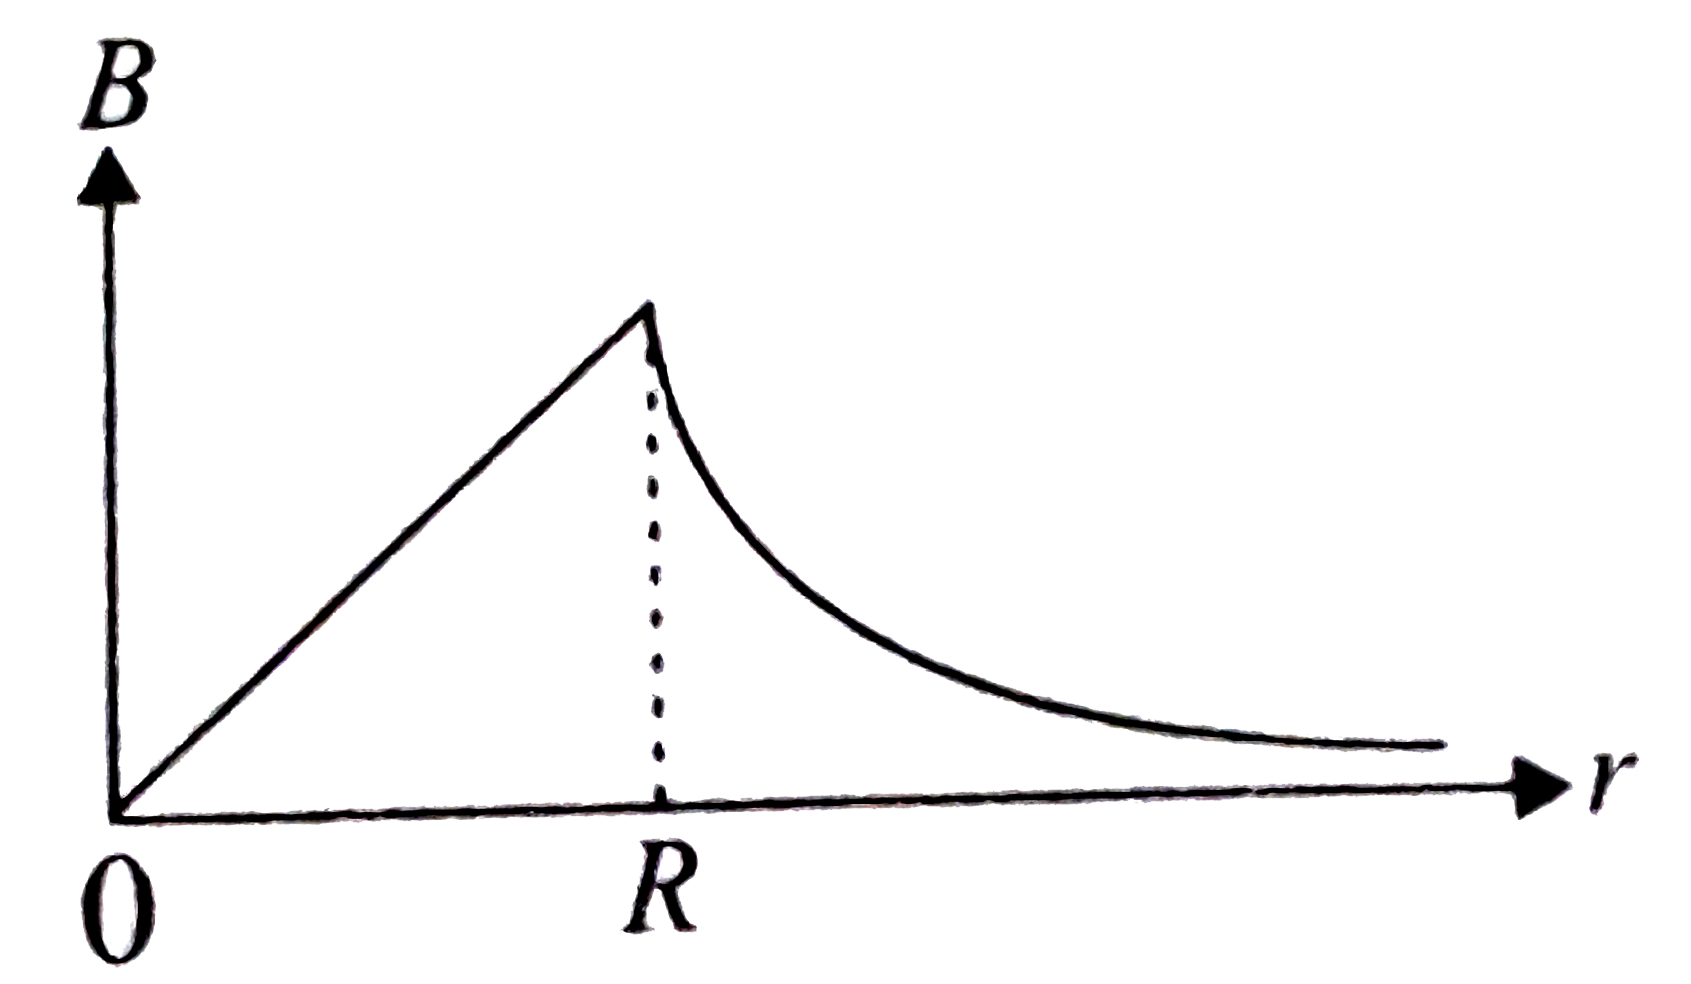
### Step 4: Plotting the Magnetic Field
Now, we can summarize the behavior of the magnetic field \( B \) as follows:
- For \( r < R \): \( B \) increases linearly with \( r \).
- For \( r = R \): \( B \) reaches a maximum value of \( \frac{\mu_0 I}{2 \pi R} \).
- For \( r > R \): \( B \) decreases inversely with \( r \).
### Step 5: Drawing the Graph
1. Start the graph at the origin (0,0).
2. As \( r \) increases from 0 to \( R \), draw a straight line that rises linearly.
3. At \( r = R \), mark the maximum value of \( B \).
4. After \( r = R \), draw a curve that decreases towards the x-axis, approaching zero but never touching it.
### Conclusion
The correct plot of the magnitude of the magnetic field \( B \) versus distance \( r \) from the center of the wire is characterized by an initial linear increase (for \( r < R \)), reaching a maximum at \( r = R \), and then a decrease (for \( r > R \)) that follows an inverse relationship.