A
B
C
D
Text Solution
Verified by Experts
The correct Answer is:


Topper's Solved these Questions
OSCILLATIONS
NCERT FINGERTIPS|Exercise Forced Oscillation And Resonance|6 VideosOSCILLATIONS
NCERT FINGERTIPS|Exercise Higher Order Thinking Skills|8 VideosOSCILLATIONS
NCERT FINGERTIPS|Exercise Some Systems Executing Simple Harmonic Motion|29 VideosMOTION IN A STRAIGHT LINE
NCERT FINGERTIPS|Exercise Assertion And Reason|15 VideosPHYSICAL WORLD
NCERT FINGERTIPS|Exercise Assertion And Reason|10 Videos
Similar Questions
Explore conceptually related problems
NCERT FINGERTIPS-OSCILLATIONS -Damped Simple Harmonic Motion
- A particle oscillating under a force vecF=-kvecx-bvecv is a (k and b a...
Text Solution
|
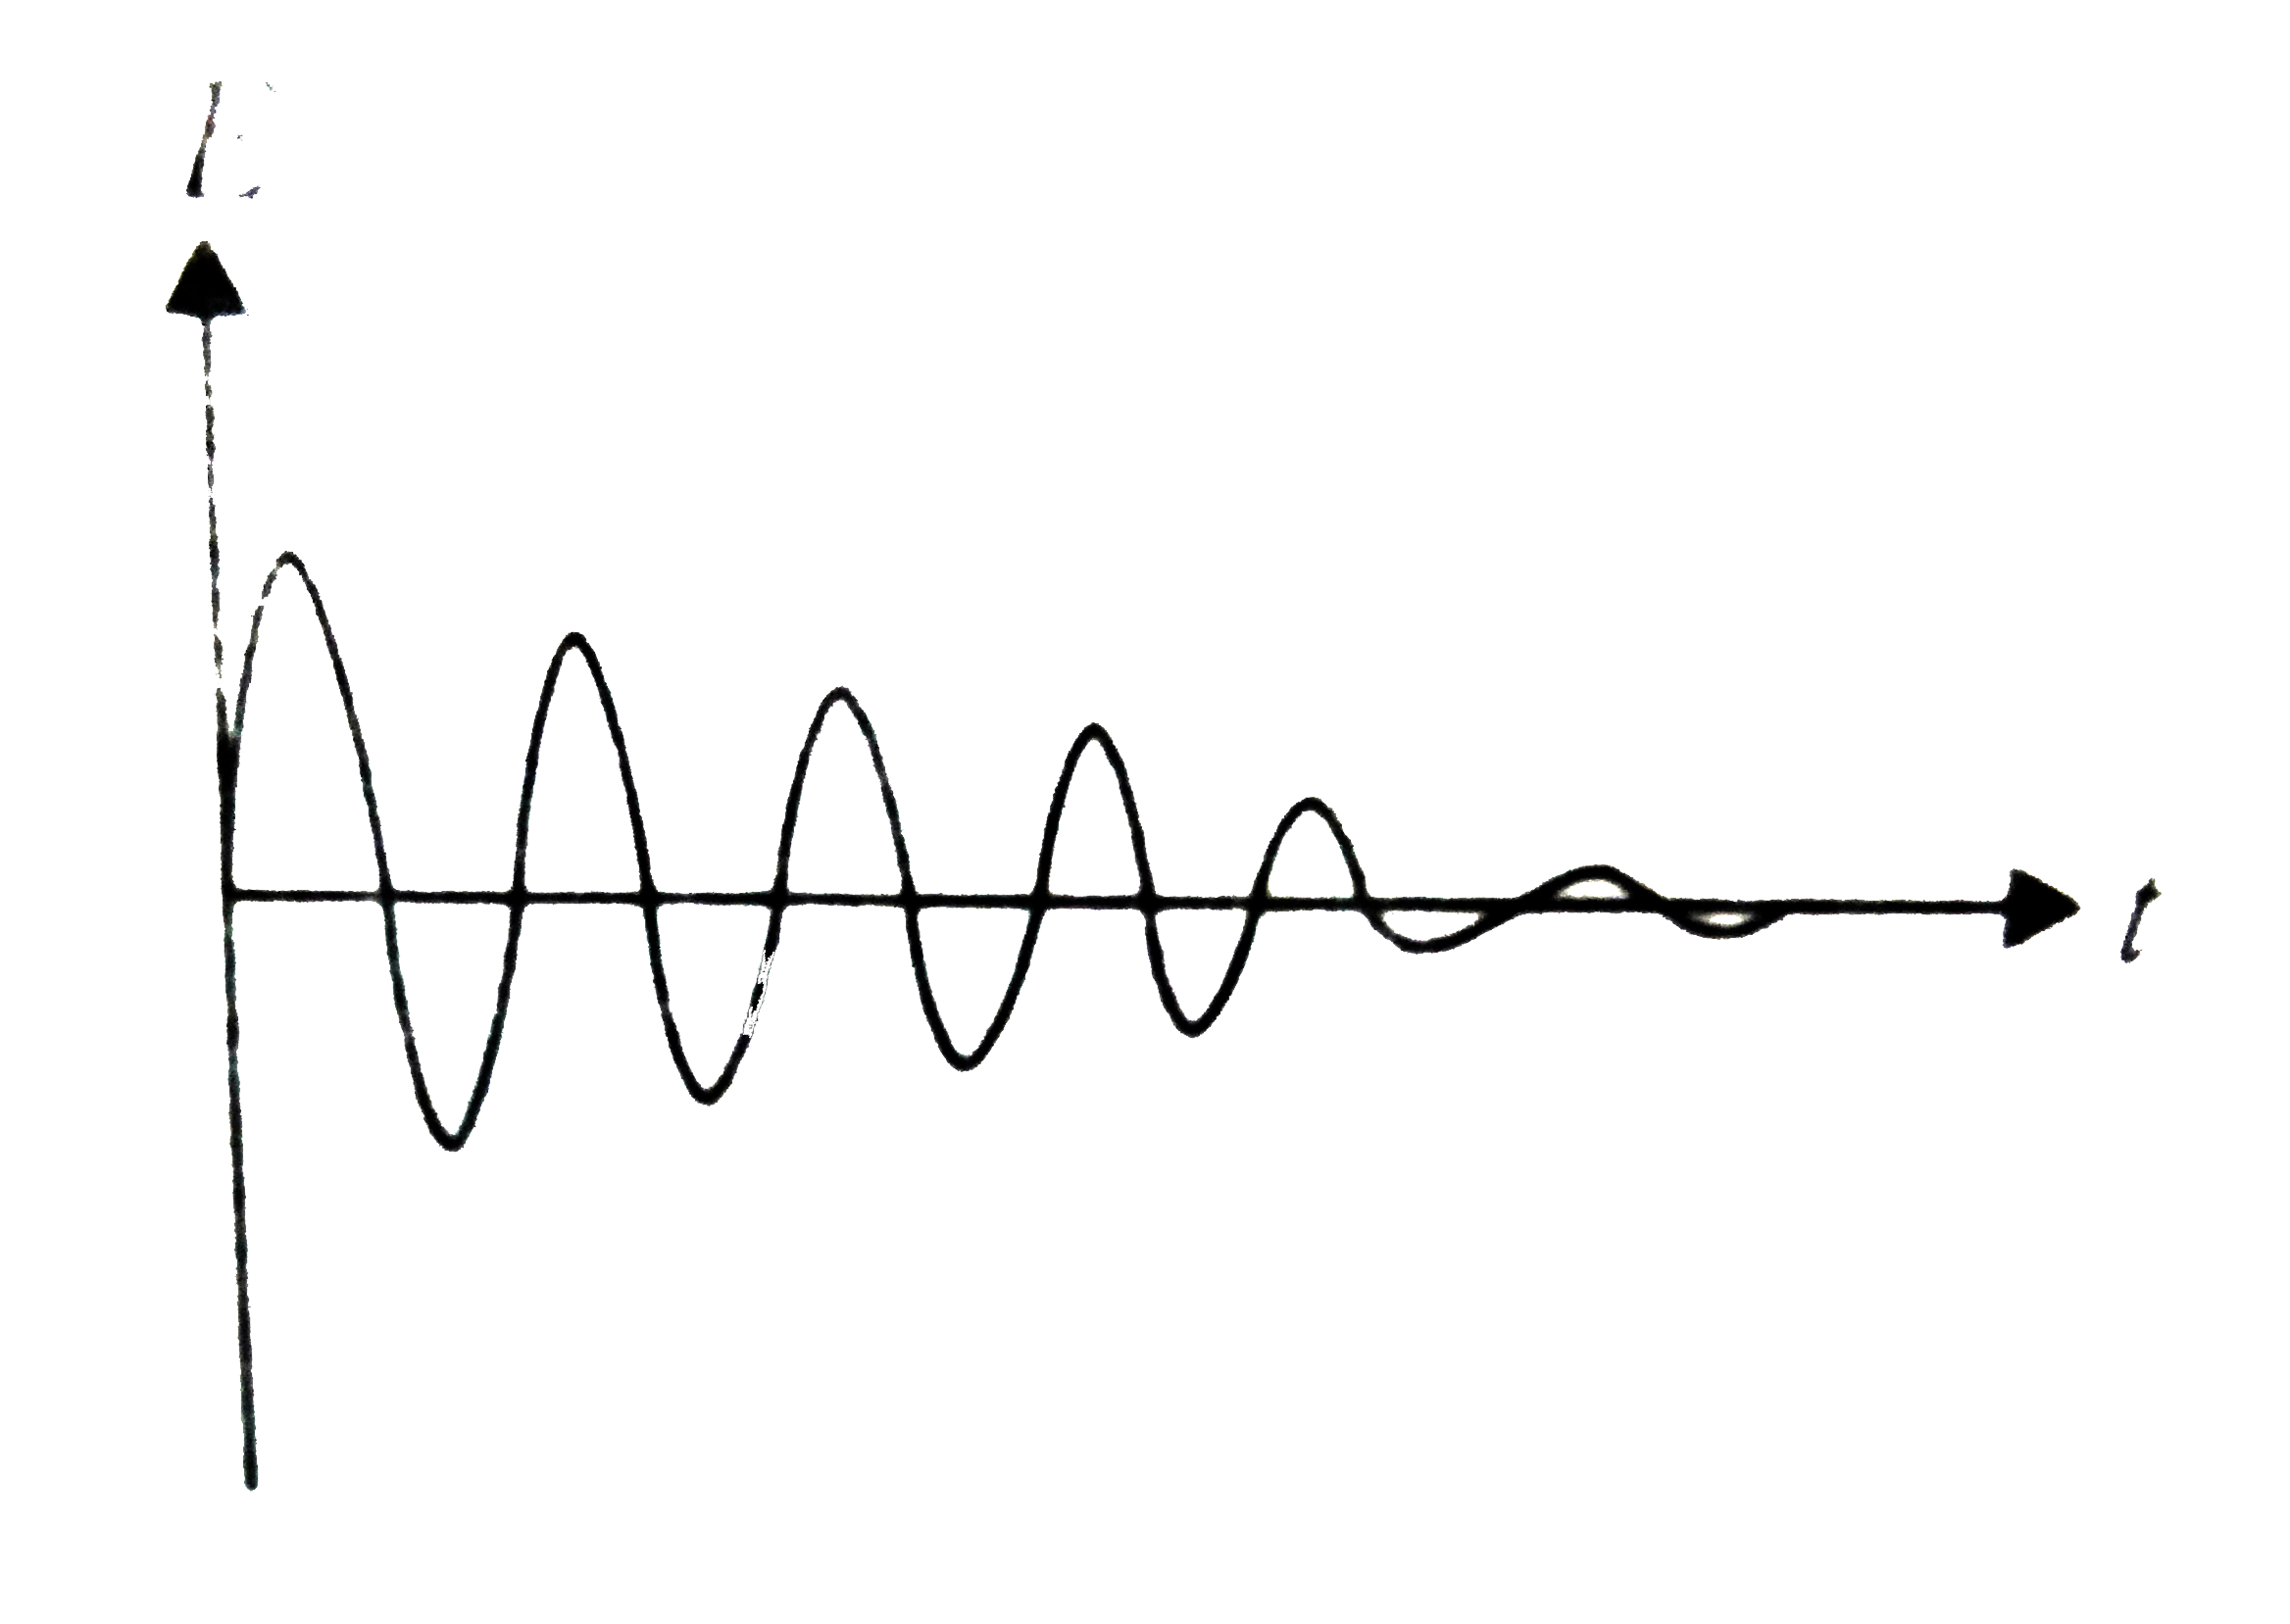
- Which of the following displacement-time graphs represent damped harmo...
Text Solution
|
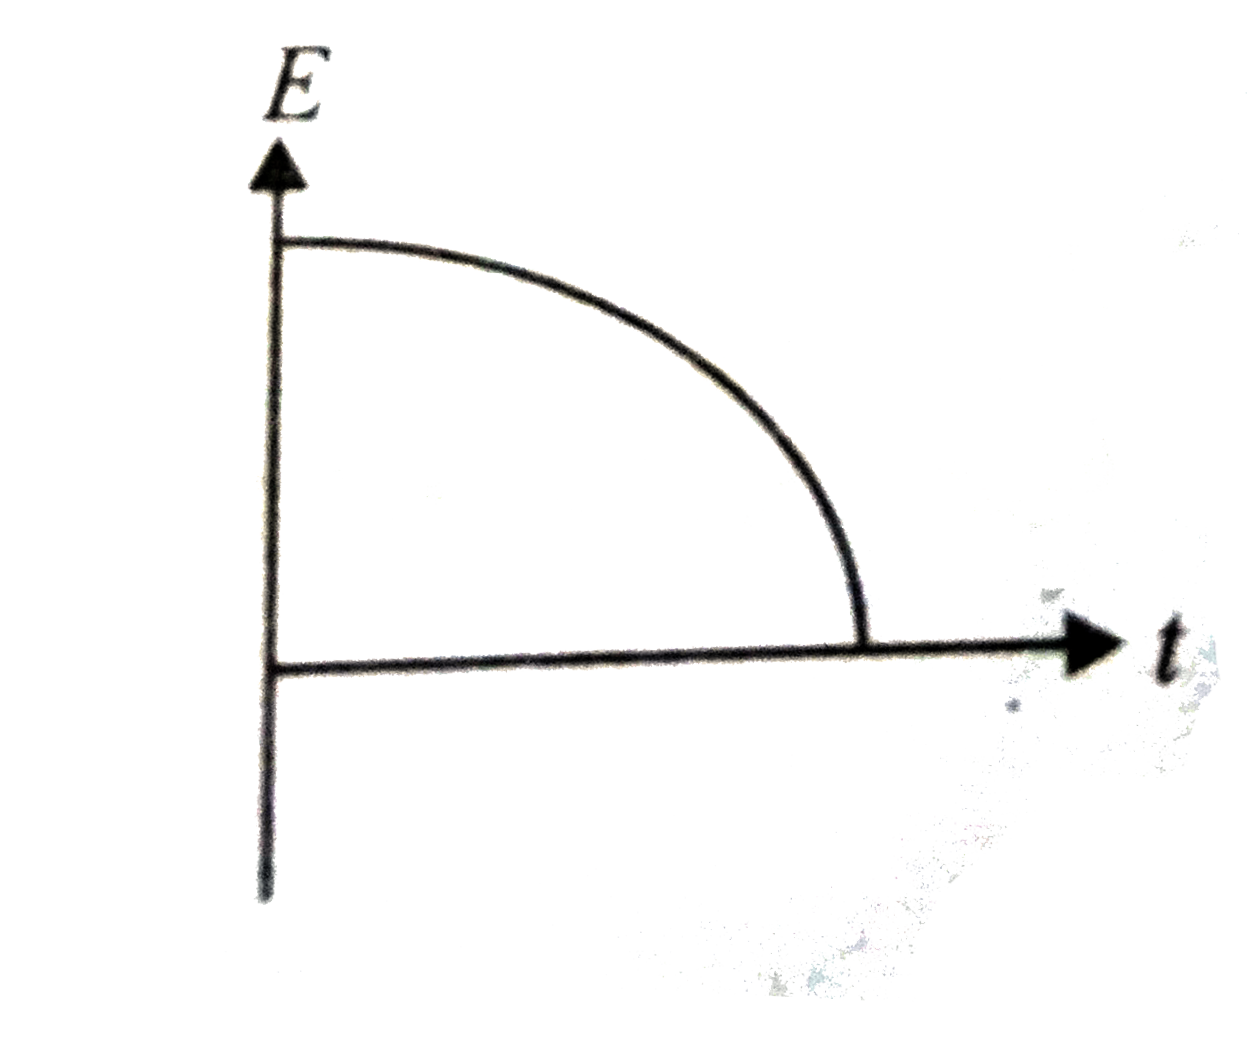
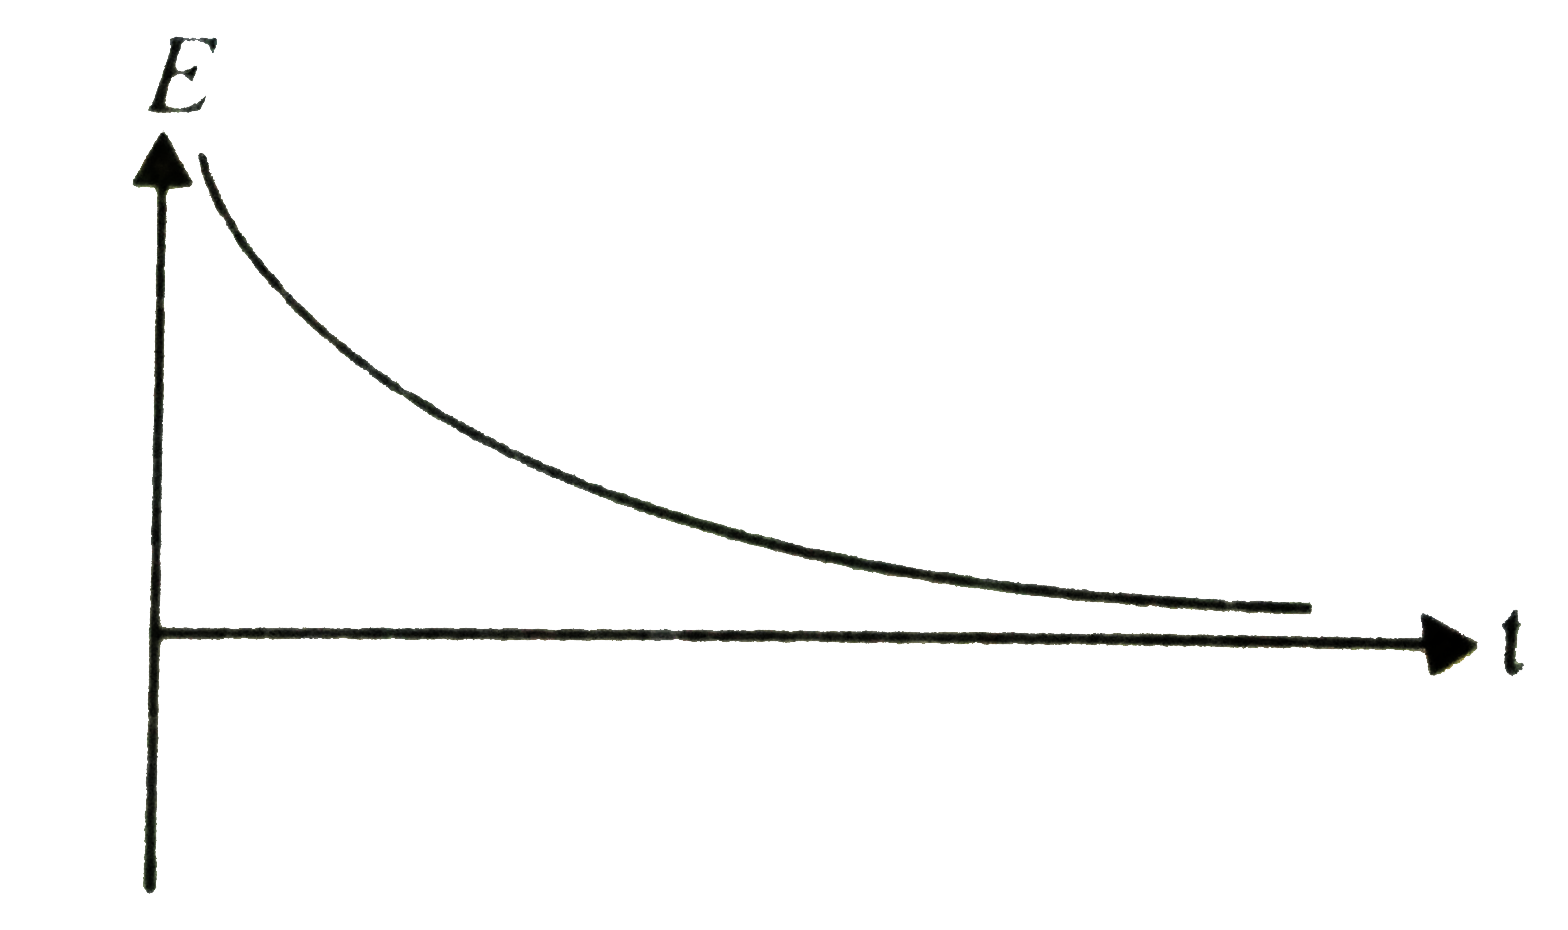
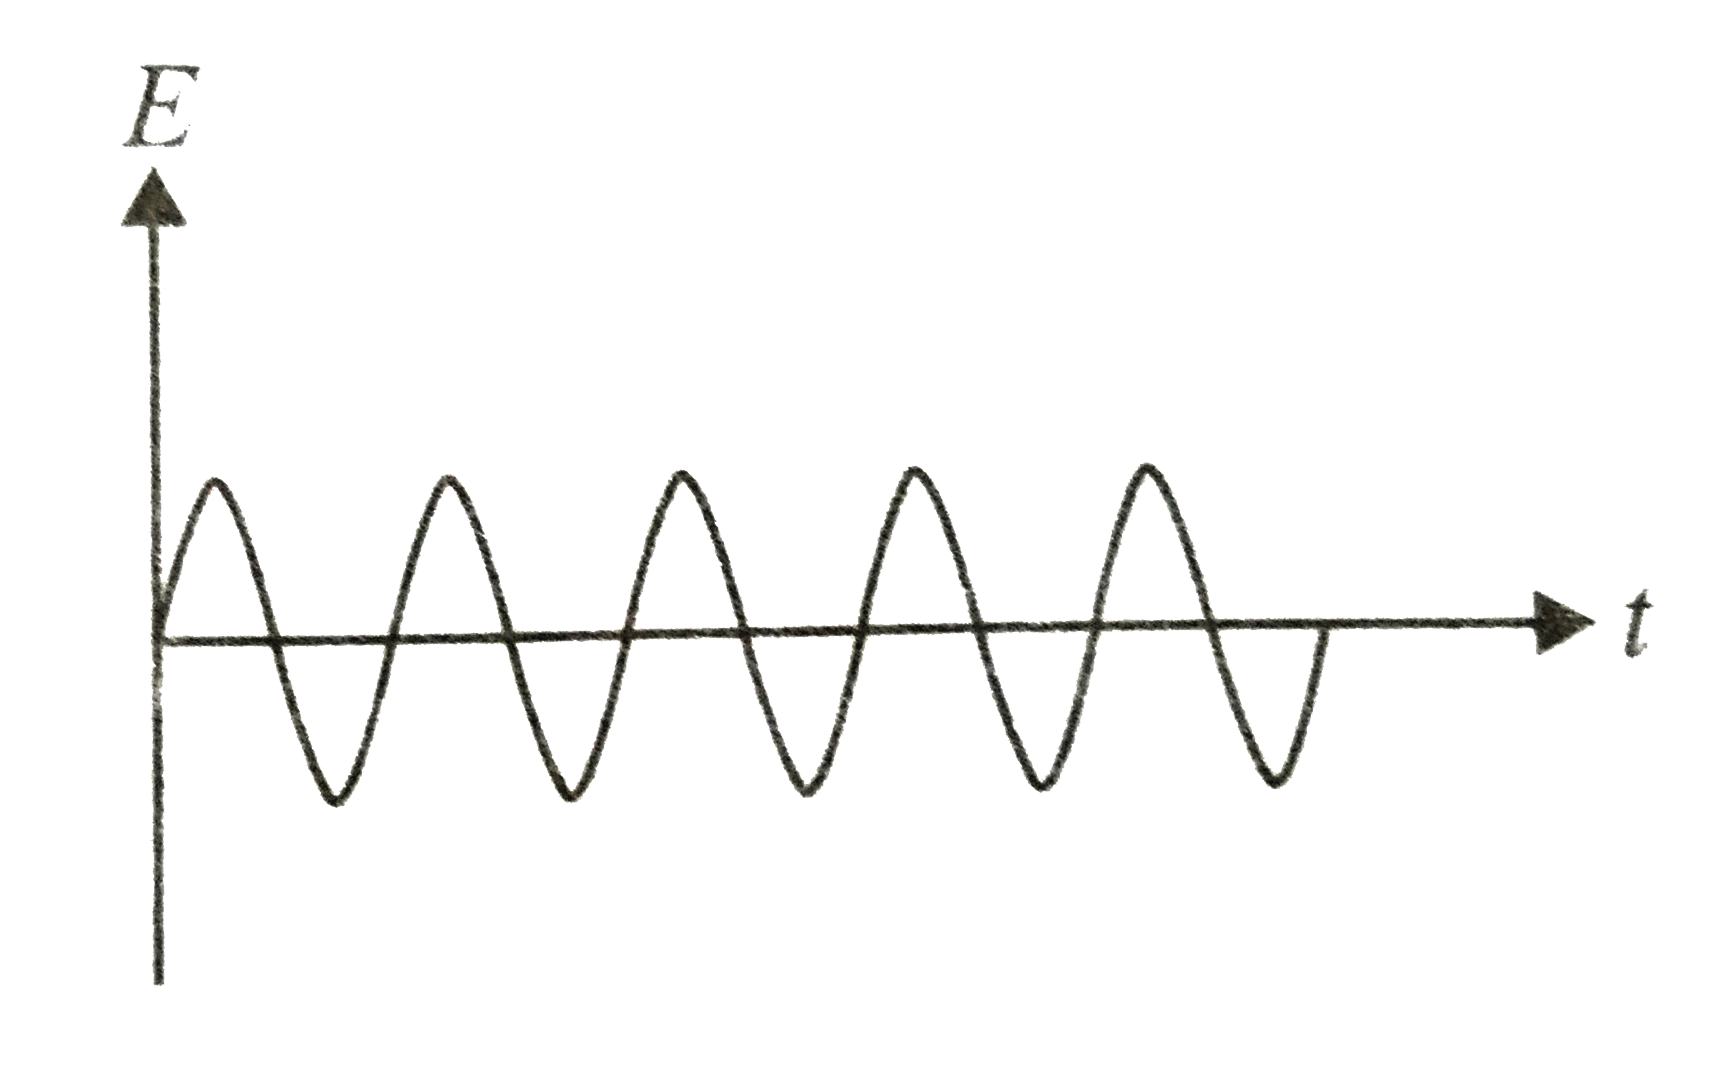
- Which of the following energy-time graphs represents dajmped harmonic ...
Text Solution
|
- A block off mass 200 g executing SHM under the unfluence of a spring o...
Text Solution
|
- In the question number 93, the time elapsed for its mechanical energy ...
Text Solution
|