A
B
C
D
Text Solution
Verified by Experts
The correct Answer is:


Topper's Solved these Questions
STATES OF MATTER
NCERT FINGERTIPS|Exercise Ideal Gas Equation|33 VideosSTATES OF MATTER
NCERT FINGERTIPS|Exercise Kinetic Energy And Molecular Speeds|4 VideosSTATES OF MATTER
NCERT FINGERTIPS|Exercise MCQs|3 VideosSOME BASIC CONCEPTS OF CHEMISTRY
NCERT FINGERTIPS|Exercise Assertion And Reason|10 VideosSTRUCTURE OF ATOM
NCERT FINGERTIPS|Exercise Assertion And Reason|15 Videos
Similar Questions
Explore conceptually related problems
NCERT FINGERTIPS-STATES OF MATTER -The Gas Laws
- If P,V,and T represent pressure, volume and temperature of the gas res...
Text Solution
|
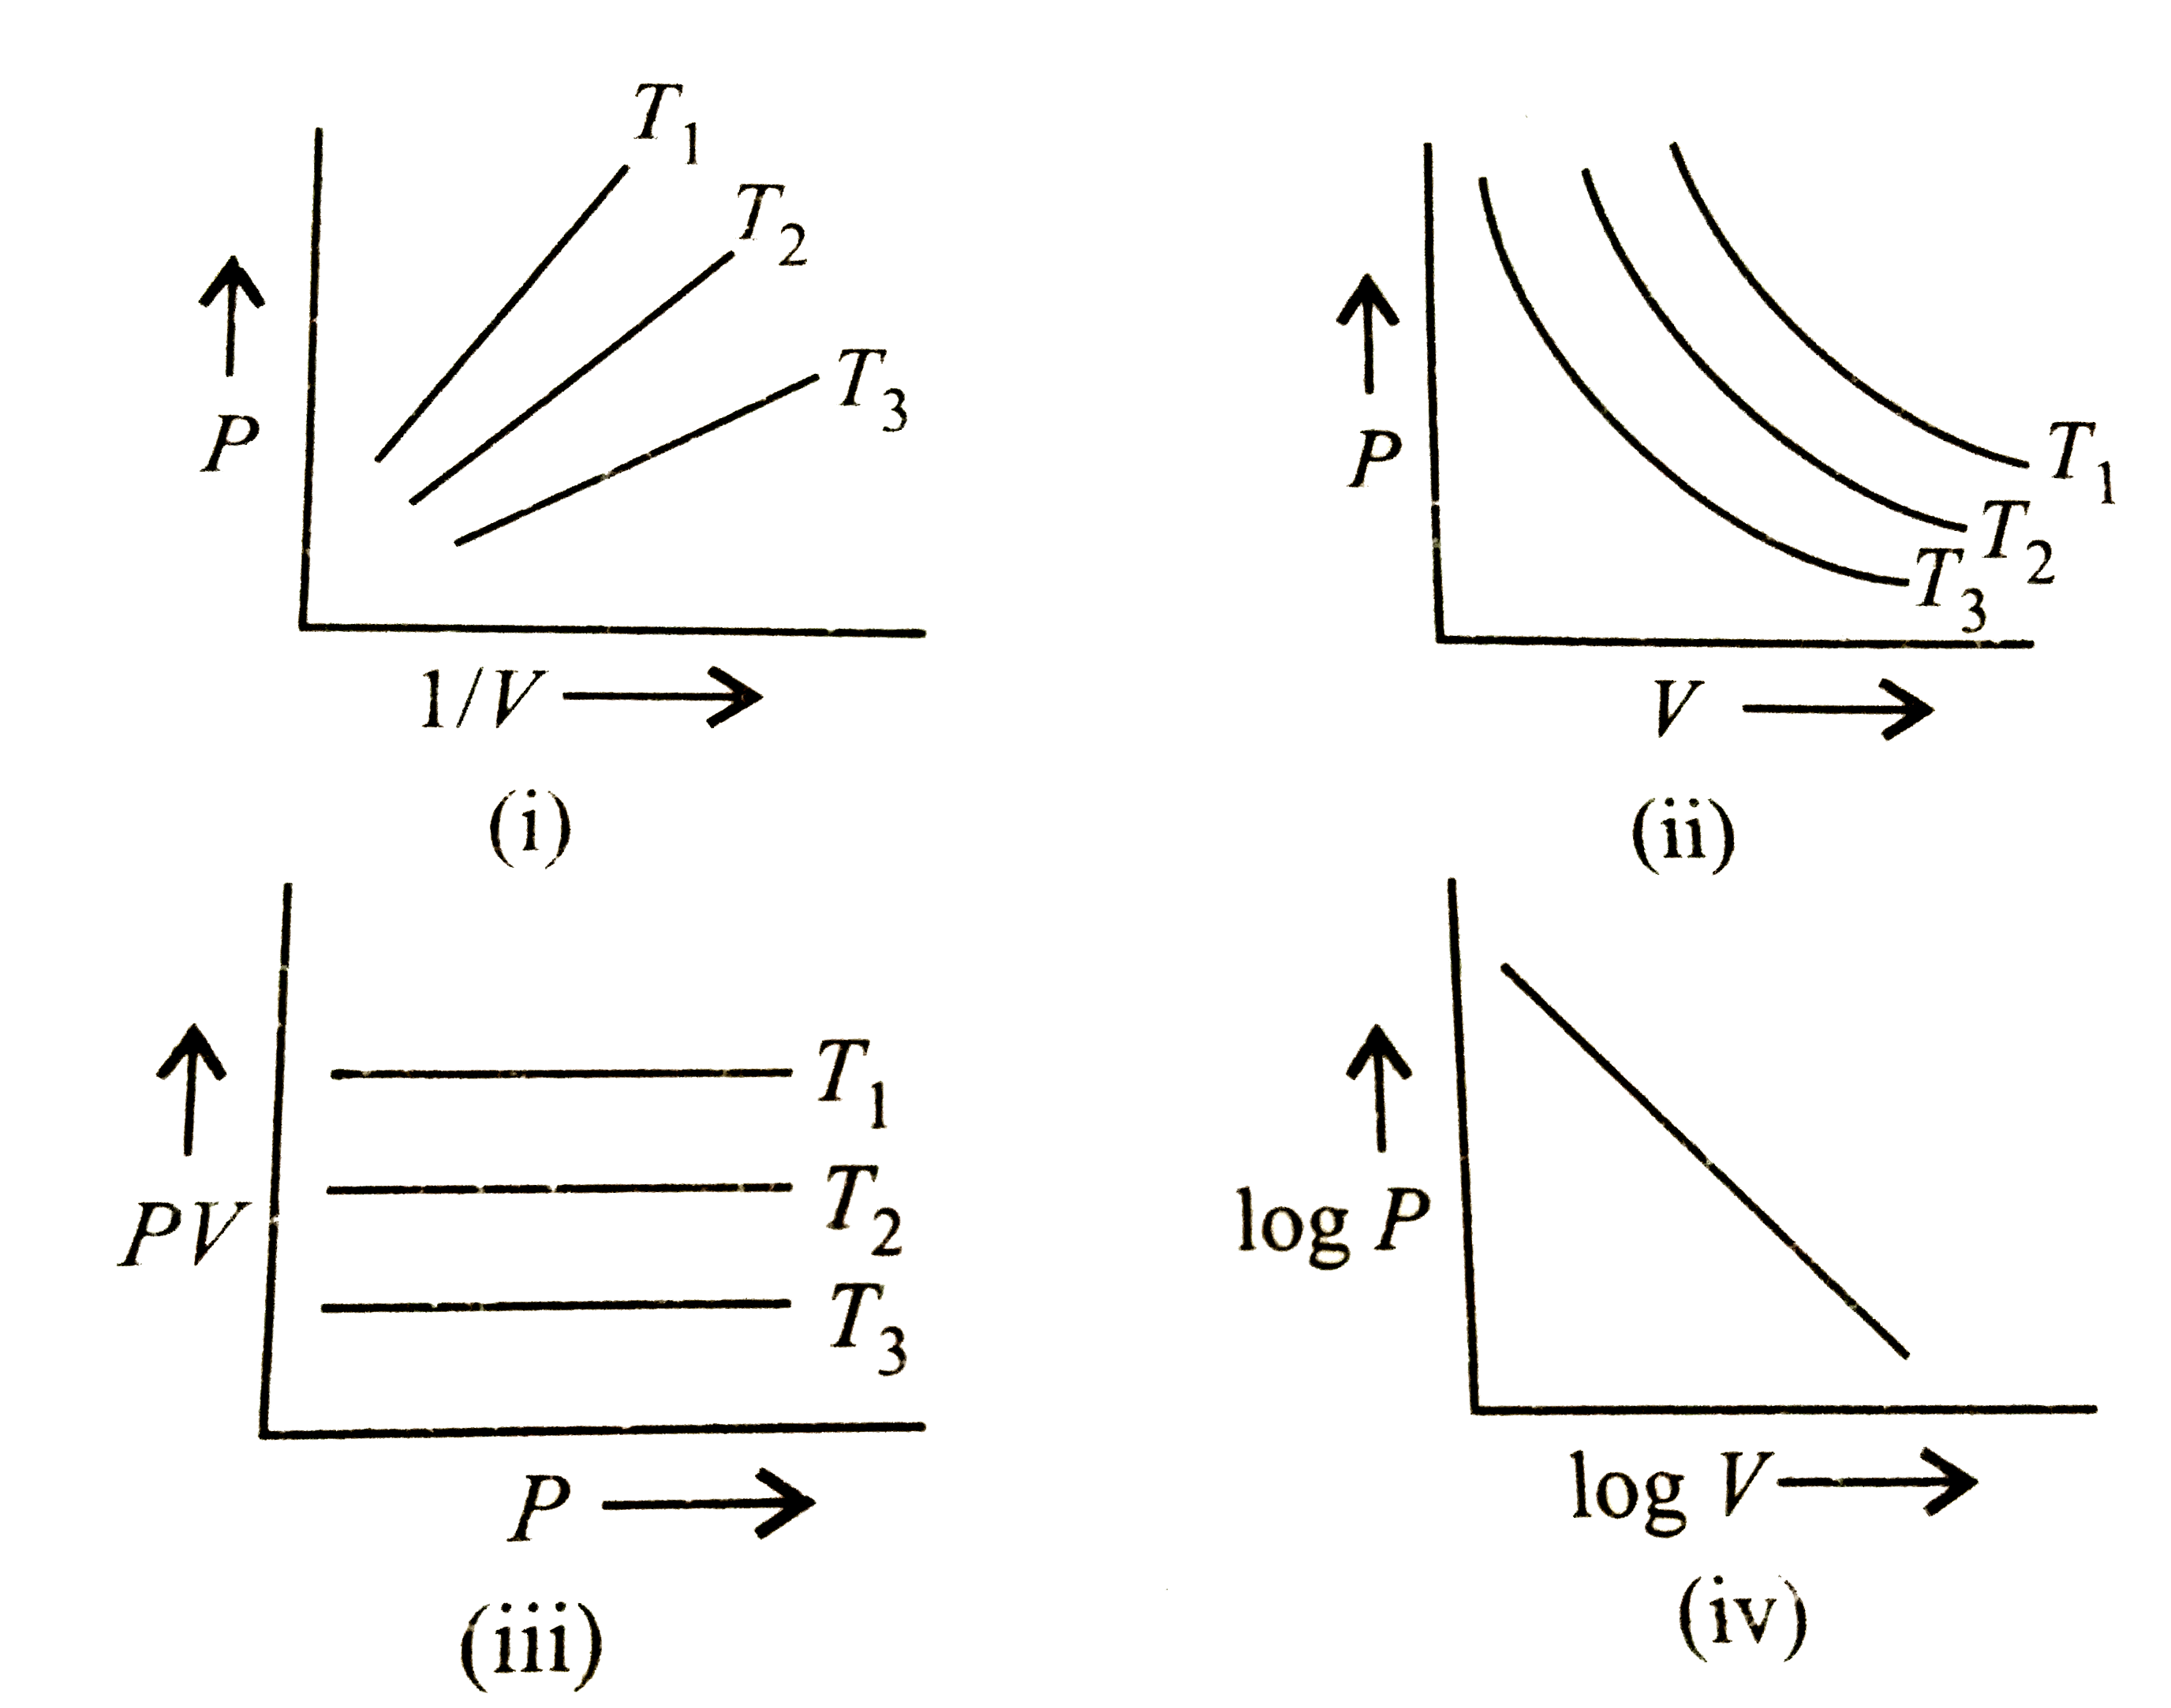
- Which of the following graphs represents the correct Boyle's law ?
Text Solution
|
- Graphs between pressure and volume are plotted at different temperatur...
Text Solution
|
- Which one of the given pressure versus volume plots represents Boyle's...
Text Solution
|
- What is the effect on the pressure of a gas if its temperature is incr...
Text Solution
|
- A flask of capacity 2 L is heated from 35 C^(@) to 45 C^(@). What vol...
Text Solution
|
- Which of the following relationships for various gas laws is not corre...
Text Solution
|
- Which of the following statement does not describe Charles' law ?
Text Solution
|
- Study the following graph and mark the incorrect statement following i...
Text Solution
|
- If we plot volume of a certain mass of a gas against temperature at co...
Text Solution
|
- Absolute zero is defined as the temperture
Text Solution
|
- A plot of P vs T for a given mass of gas at constant volume is a strai...
Text Solution
|
- At NTP the volume of a gas is 40 mL . If pressure is increased to 800 ...
Text Solution
|
- Volume of a given mass of gas at 17 °C is measured as 200 cm^3. The vo...
Text Solution
|
- An open flask contains air at 27^(@)C Calculate the temperature at whi...
Text Solution
|