Home
Class 10
MATHS
The following table shows the daily supp...

The following table shows the daily supply of electricity to different places in a town. To show the information by a pie diagram measure of central angles of sectors are to be decided. Complete the following activity to find the measures:

Text Solution

Verified by Experts

The correct Answer is:
`(12)/(30);72^(@);(8)/(30);96^(@)`
Promotional Banner

Topper's Solved these Questions

  • BOARD'S QUESTION PAPER

    NAVNEET PUBLICATION - MAHARASHTRA BOARD|Exercise QUESTION|30 Videos
  • CHALLENGING QUESTIONS

    NAVNEET PUBLICATION - MAHARASHTRA BOARD|Exercise EXAMPLE FOR PRACTICE|22 Videos

Similar Questions

Explore conceptually related problems

The following table shows the daily supply of electricity to differenet places in a town. To show the information by a pie diagram, measures of central angles of sectors are to be decided. Complete the following activity to find the measures.

The following table shows the daily supply of electricity to different places in a town. Show the information by a pie diagram.

The following table shows the percentages of demands for different fruits registered with a fruit vendor. Show the information by a pie diagram.

The following table shows the percentages of demands for different fruits registered with a fruit vendor. Show the information by a pie diagram.

The following table shows the average rainfall in 150 towns. Towns. Show the information by a ferquency polygon.

The following table shows the percentage of buyers of four different brands of bathing soaps. Represent the above data by a pie chart.

The following table shows the percentage of vehicles passing a signal. Find out the measures of the central angles to show the information by a pie diagram. Hence draw the pie diagram.

Area of a sector is 1/12 th of the circle, then find the measure of central angle of that arc.

The following table shows causes of noise pollution. Show it by a pie diagram.

The following table shows causes of noise pollution. Show it by a pie diagram.

NAVNEET PUBLICATION - MAHARASHTRA BOARD-BOARD'S QUESTION PAPER : MARCH 2019-QUESTION
  1. For the quadratic equation x^(2) + 10x - 7 = 0 , the values of a,b,c a...

    Text Solution

    |

  2. The tax levied by the Central government for trading within state is

    Text Solution

    |

  3. A die is rolled. What is the probability that the number of on the upp...

    Text Solution

    |

  4. The fitst term and the common difference of an A.P. are 12 and 4 respe...

    Text Solution

    |

  5. If |{:(4,5),(m,3):}|=22 , then find the value of m.

    Text Solution

    |

  6. Solve the following quadratic equations by factorisation method. (i)...

    Text Solution

    |

  7. Smita invested Rupees 12,000 to purchase shares of FV Rupess 10at a pr...

    Text Solution

    |

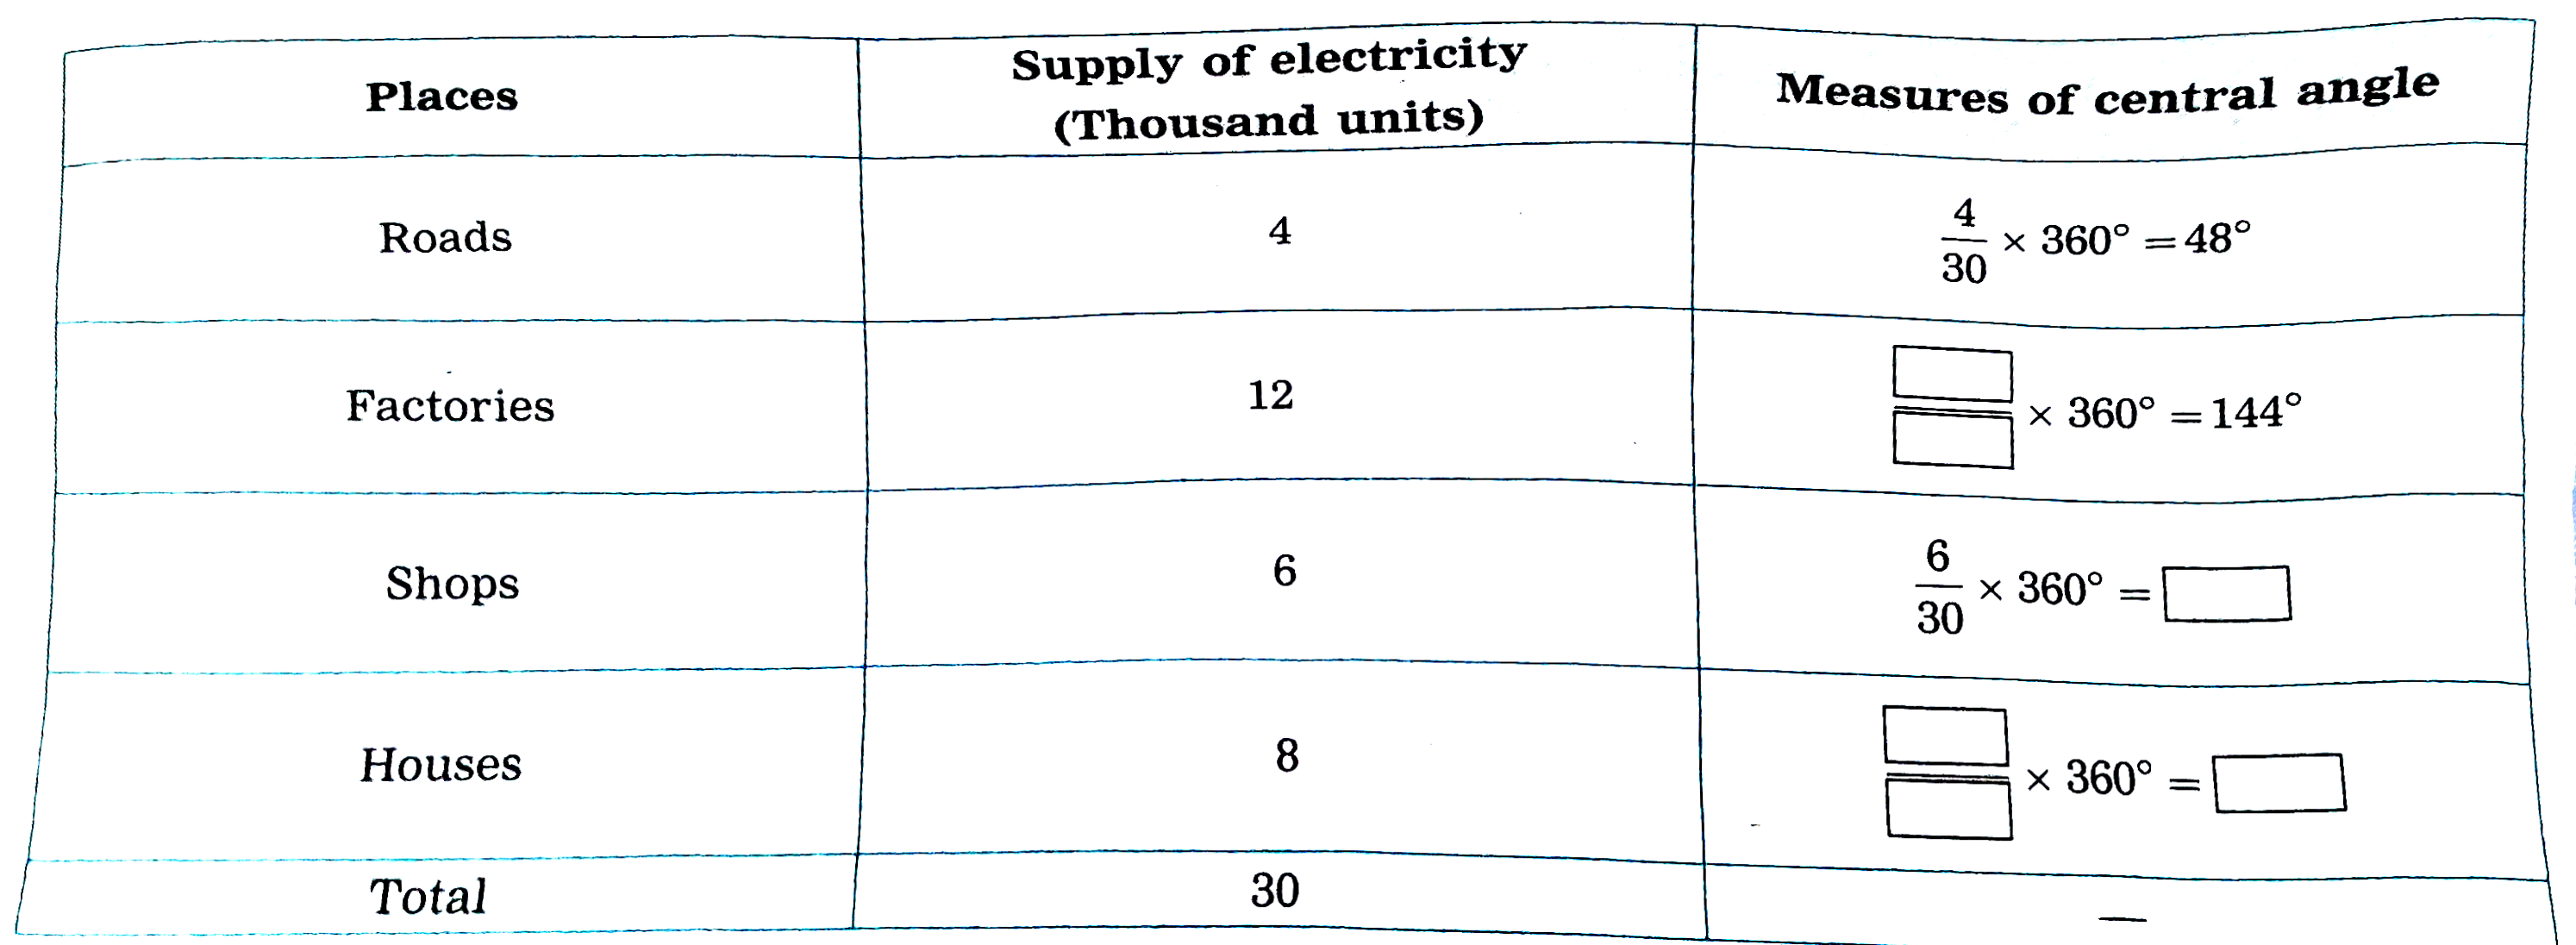
  8. The following table shows the daily supply of electricity to different...

    Text Solution

    |

  9. Two coins are tossed simultaneously. Complete the following activity ...

    Text Solution

    |

  10. Find the 19th term of the A.P. 7,13,19,25,….

    Text Solution

    |

  11. Obtain a quadratic equation whose roots are -3 and -7.

    Text Solution

    |

  12. Two numbers differ by 3. The sum of the greater number and twice the s...

    Text Solution

    |

  13. Amit saves certain amount every month in a specific way. In the first ...

    Text Solution

    |

  14. Two-digit numbers are formed from the digits 0,1,2,3 without repetitio...

    Text Solution

    |

  15. Smt Malhotra purchased solar panles for the taxable value of ₹ 85,000 ...

    Text Solution

    |

  16. Solve the following simultaneous equations graphically: x+y=0,2x-y=9...

    Text Solution

    |

  17. The following frequency distribution table shows marks obtained by 18...

    Text Solution

    |

  18. Two taps running together can fill a tank in 3(1/13) hours. If one tap...

    Text Solution

    |

  19. The coordinates of the point of intersection of lines ax+by=9 and bx+a...

    Text Solution

    |

  20. The following frequency distribution table shows the distances tr...

    Text Solution

    |