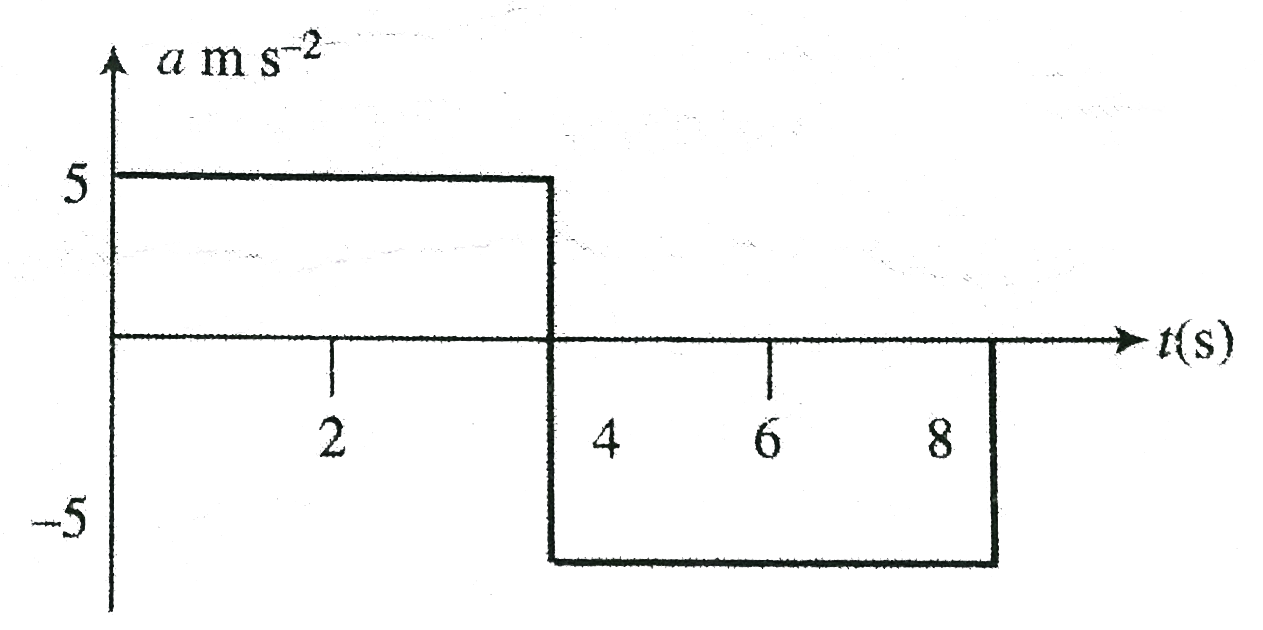
 .
. Text Solution
Verified by Experts
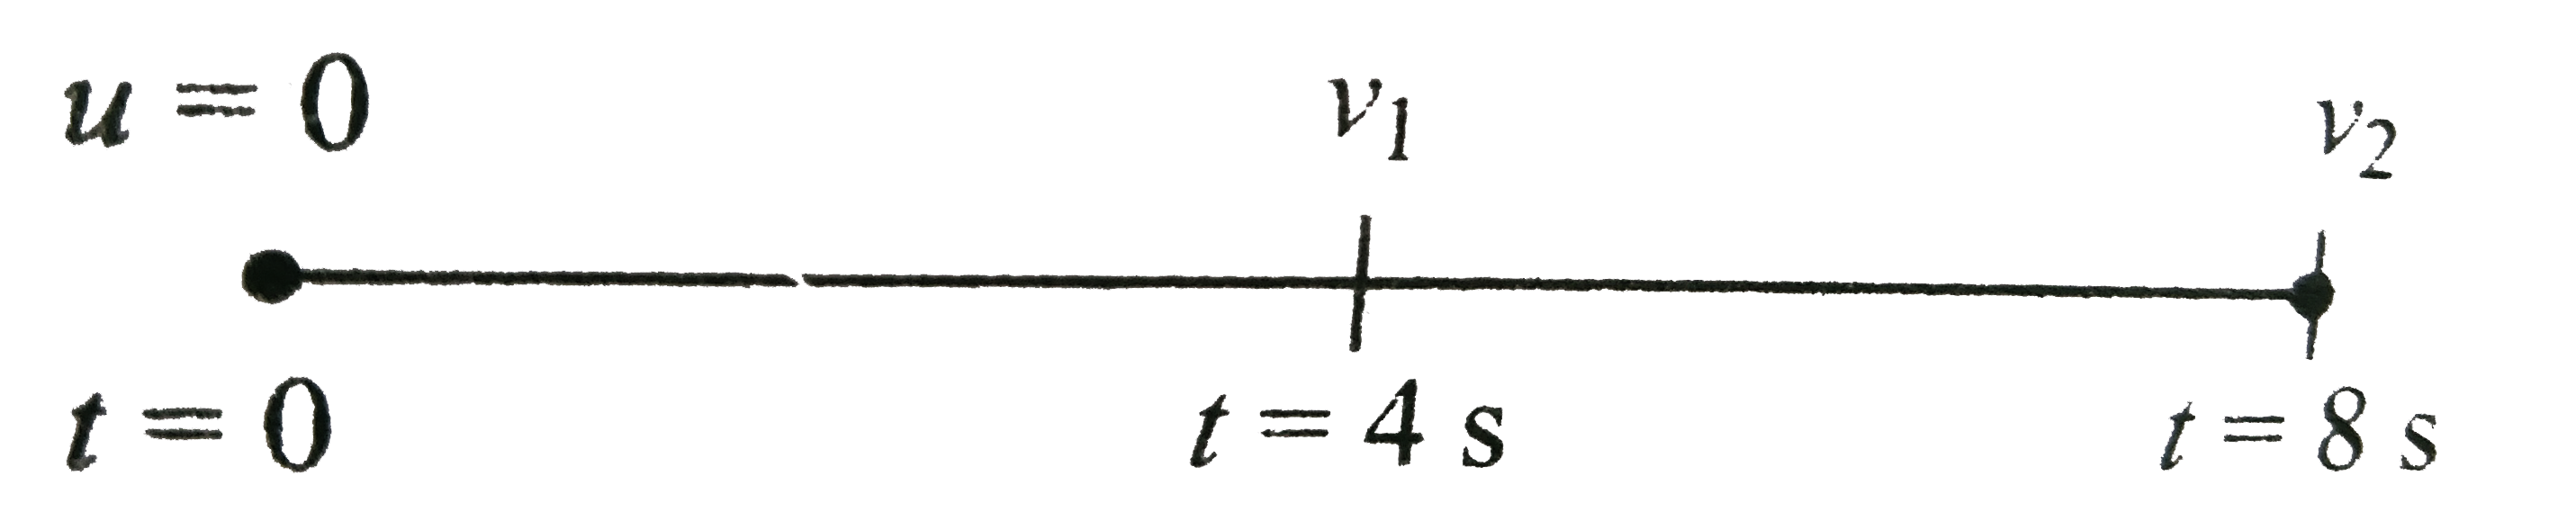 .
. 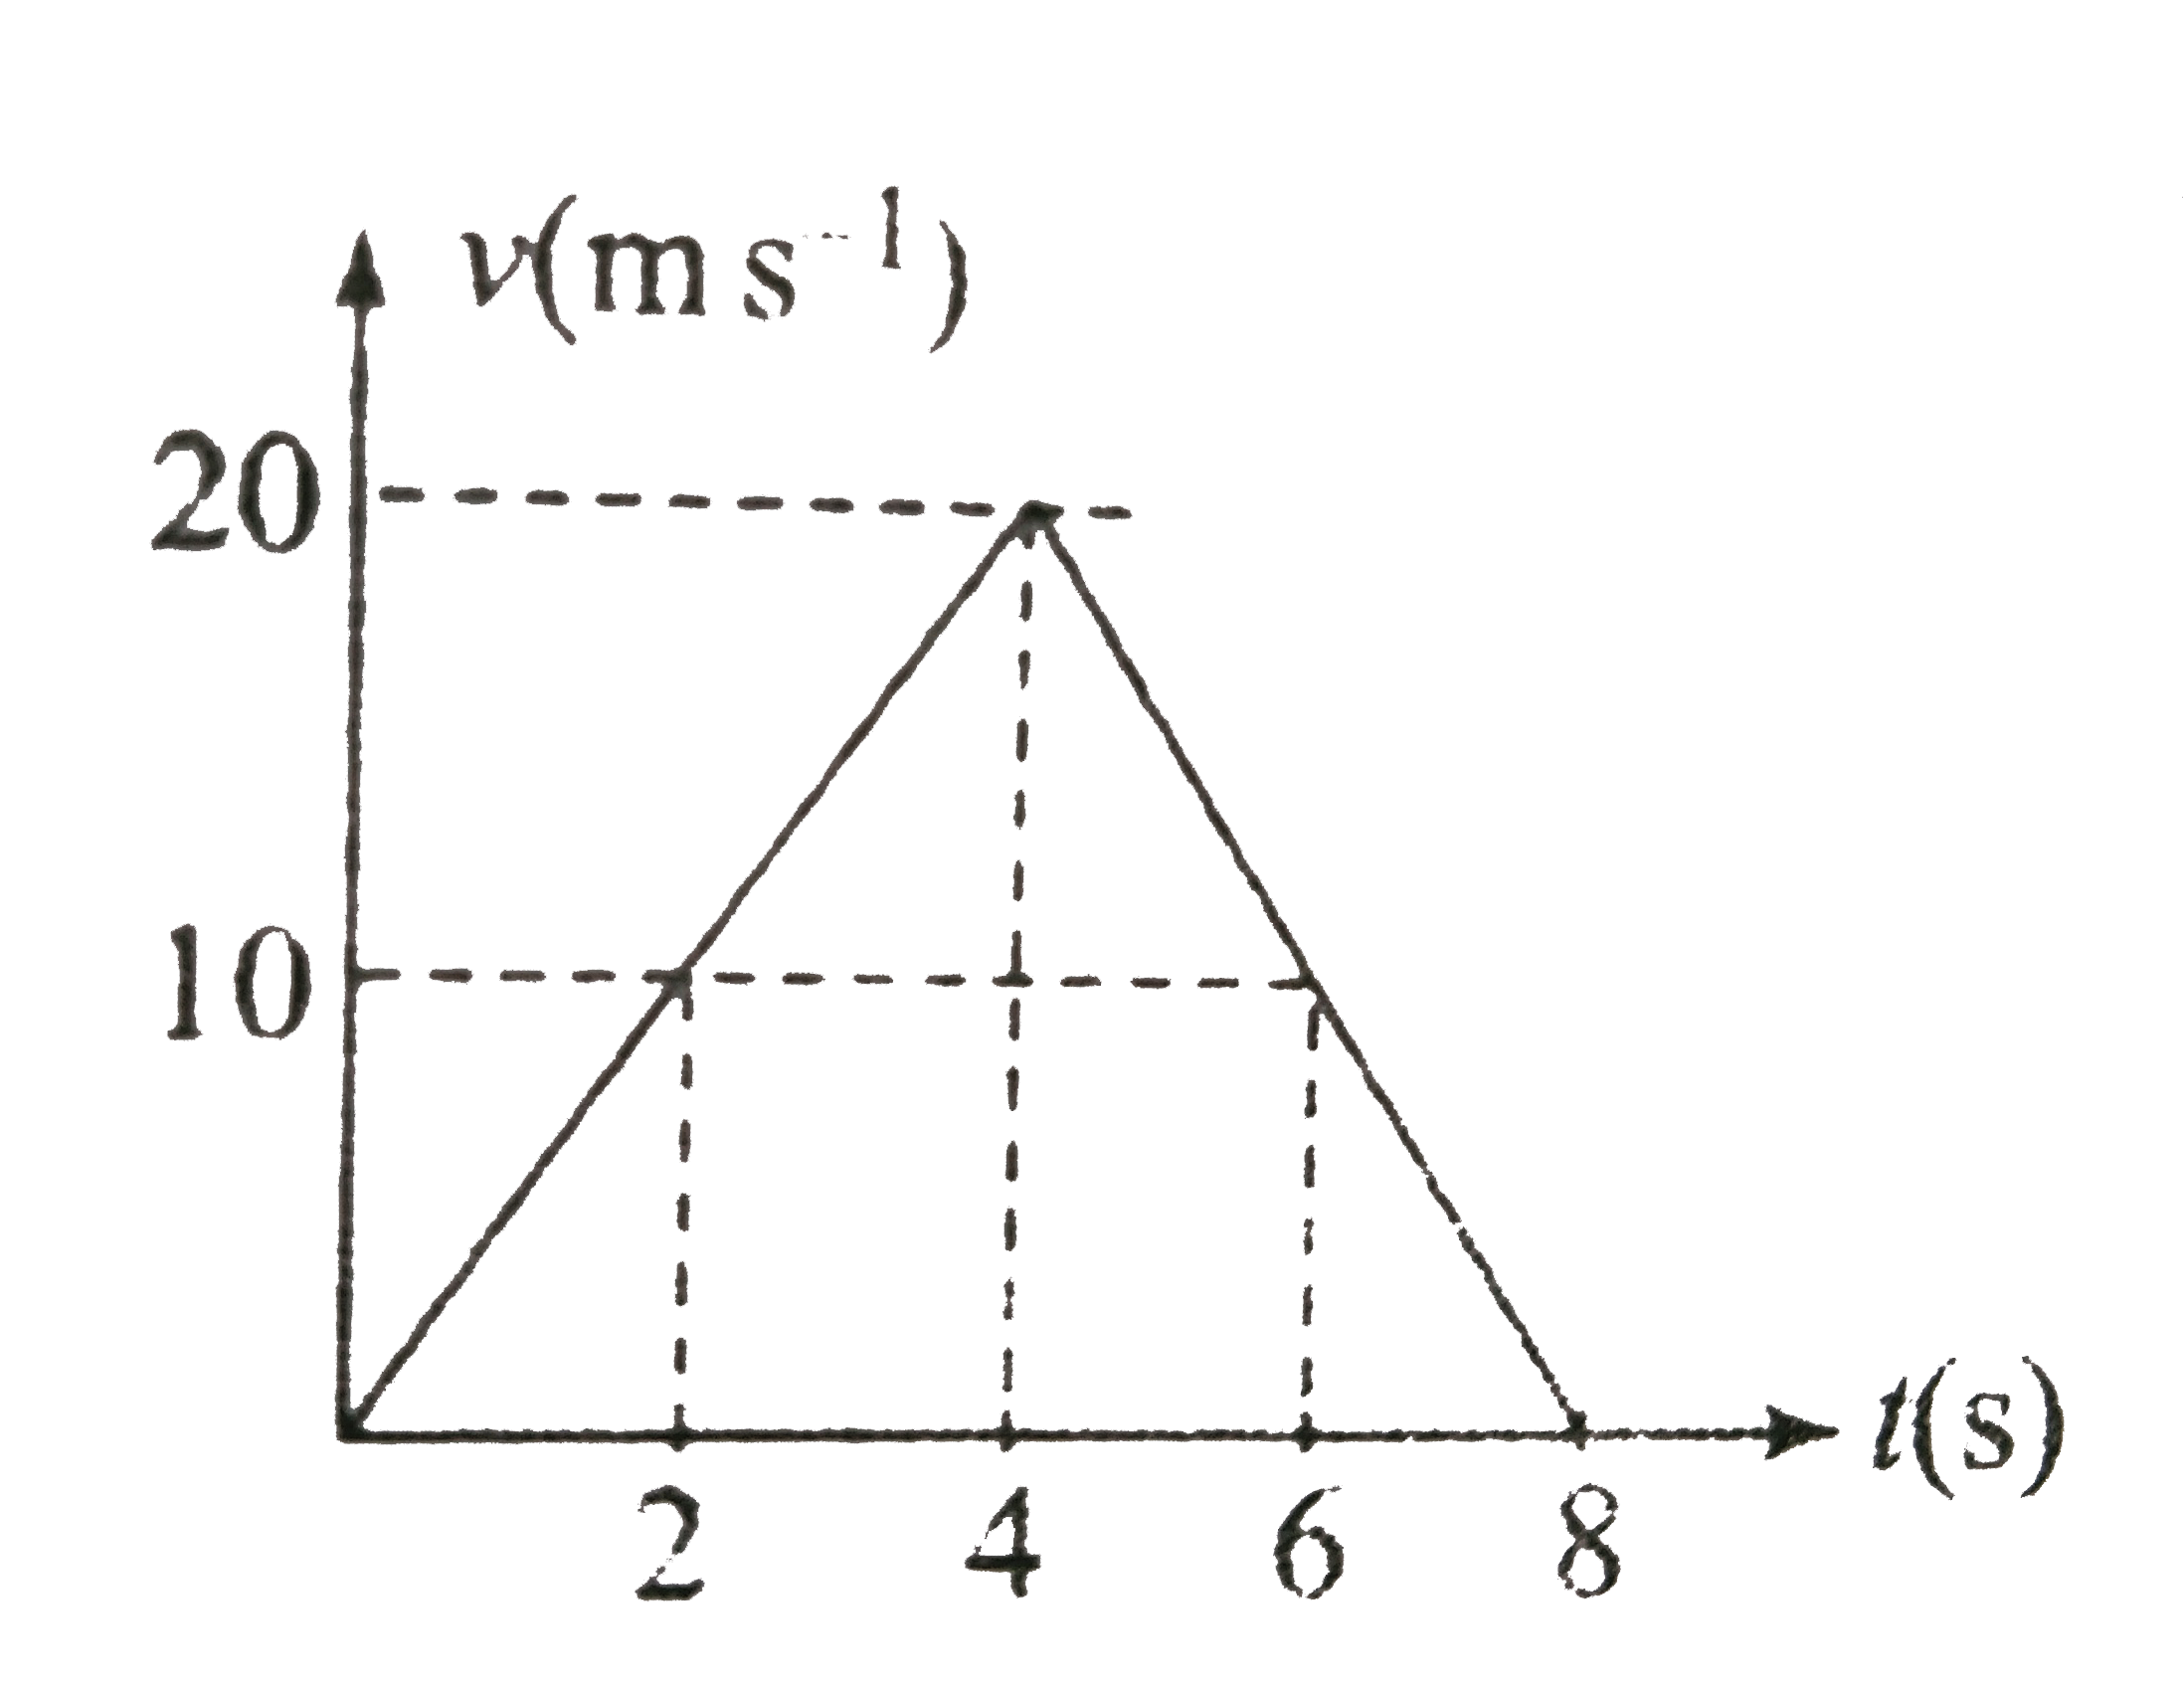 .
. 


Topper's Solved these Questions
Similar Questions
Explore conceptually related problems
CENGAGE PHYSICS-KINEMATICS-1-Exercise 4.4
- a. What can you say about velocity in each of the following position-t...
Text Solution
|
- a. A ball is thrown vertically upwards. Aftre some time it trturns to ...
Text Solution
|
- A body starts at t=0 with velcoity u and travels along a straight ling...
Text Solution
|
- Find the average acceleration in first 20 s. (Hint: Area under a-t fra...
Text Solution
|
- At t=0, a particle starts from reat and moves along a straight line, w...
Text Solution
|
- Given below shows the desplacemen-time graph for a particle moving alo...
Text Solution
|
- You are given the position-time graph of three deffernt bodies A,B, an...
Text Solution
|
- A physics professor leaves her house and walks along the sidewalk towa...
Text Solution
|
- Shows the position-time graphs of three cars A,B and C On the basis of...
Text Solution
|
- A cockroach moves rectilinearly such that after sometime t(0) let its ...
Text Solution
|
- A car accelerates from rest at a constant rate alpha for some time, af...
Text Solution
|
- Two cars, A and B move along the x-axis. Car A starts from rest with c...
Text Solution
|
- A rigid ball traveling in a straight line the x-axis hits a soled wall...
Text Solution
|
- Refering to v-s diagram, find: . a. Acceleration of the particle w...
Text Solution
|
- A racing motor boat speeds up in a straight line in a lake, from rest....
Text Solution
|
- Referring a-s diagram in , find the velocity after particle travel 120...
Text Solution
|