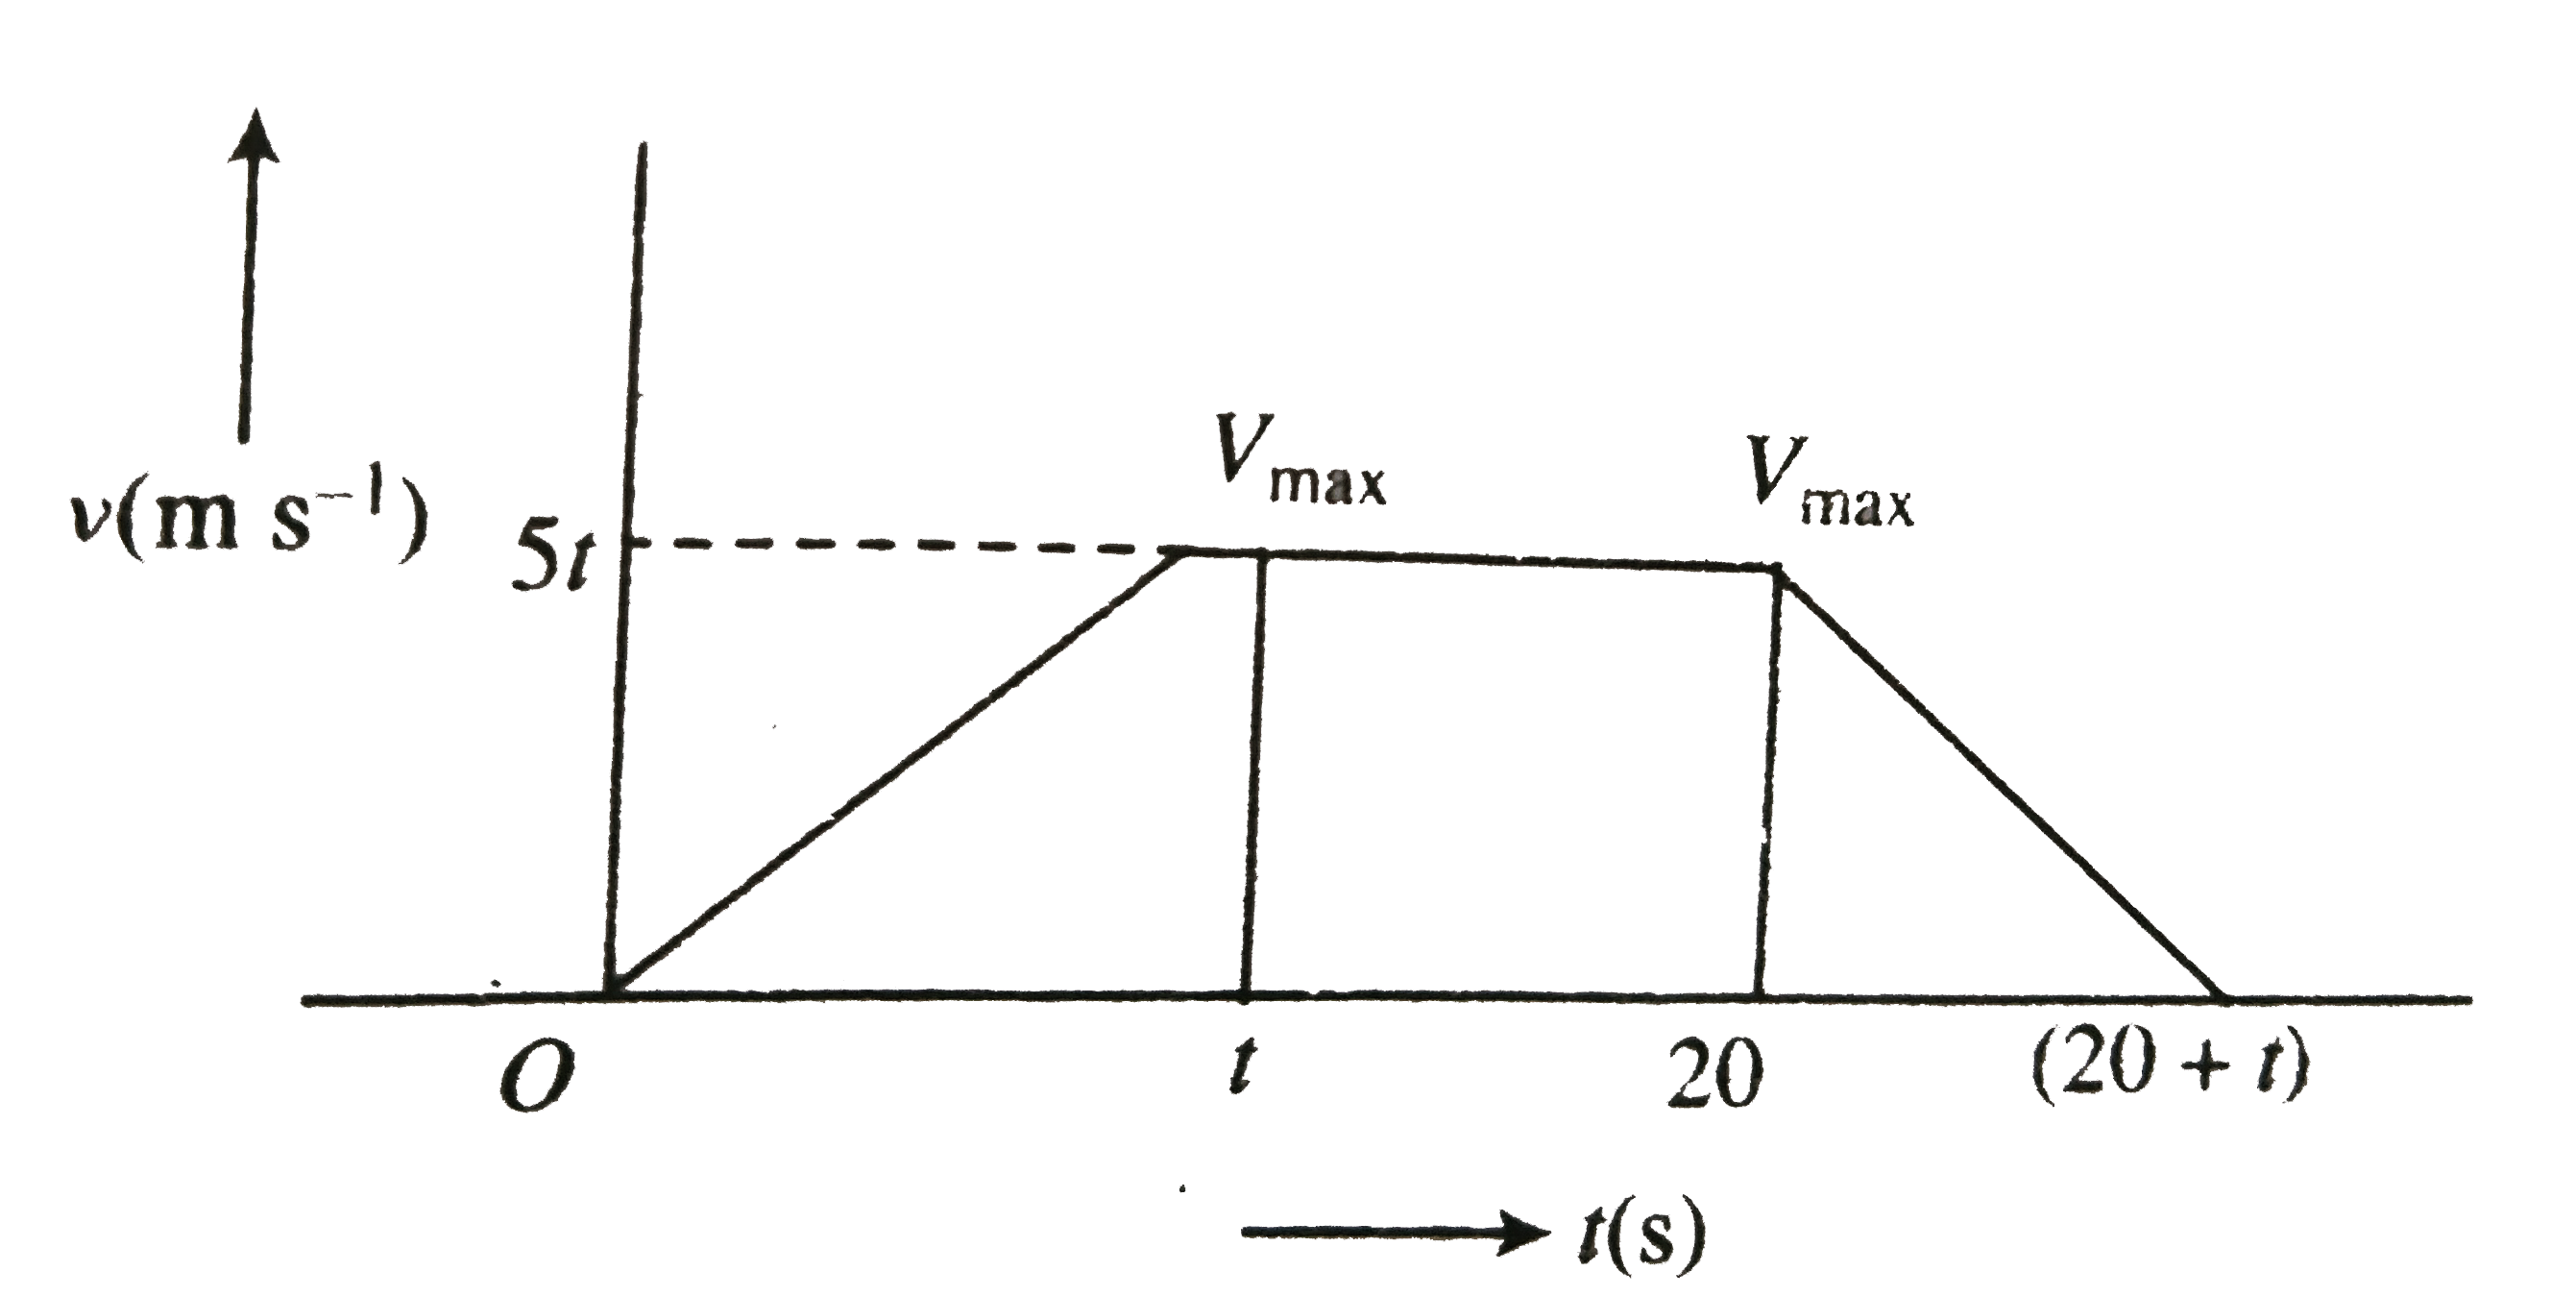
Home
Class 11
PHYSICS
The velocity-time graph of a particle mo...

The velocity-time graph of a particle moving along a straight line is shown is . The rate of acceleration and deceleration is constant and it is equal to `5 m s^(-2)`. If the a average velocity during the motion is `20 m s^(-1)`, Then .
The value of `t` is.

A

`5 s`

B

`10 s`

C

`20 s`

D

`5sqrt 2s`

Text Solution

Verified by Experts

The correct Answer is:
a

Average speed `=20 m s^(-2)`
`(Total distance )/(Total time) =20`
.
`rArr ("Area of graph")/(20 +t) =20`
` rArr (1)/(2) (20+t+ 20 -t )xx 5t =20 (20+ t) rArr t=5 s`.
Promotional Banner

Topper's Solved these Questions

  • KINEMATICS-1

    CENGAGE PHYSICS|Exercise Integer|9 Videos
  • KINEMATICS-1

    CENGAGE PHYSICS|Exercise Assertion-reasoning|5 Videos
  • GRAVITATION

    CENGAGE PHYSICS|Exercise INTEGER_TYPE|1 Videos
  • KINEMATICS-2

    CENGAGE PHYSICS|Exercise Exercise Integer|9 Videos

Similar Questions

Explore conceptually related problems

The velocity-time graph of a particle moving along a straight line is shown is Fig. The rate of acceleration and deceleration is constant and it is equal to 5 m s^(-2) . If the a average velocity during the motion is 20 m s^(-1) , Then . The maximum velocity of the particle is .

The velocity-time graph of a particle moving along a straight line is shown is Fing. The rate of acceleration and deceleration is constant and it is equal to 5 m s^(-2) . If the a average velocity during the motion is 20 m s^(-1) , Then . The distace travelled with uniform velcoty is .

The velocity- time graph of the particle moving along a straight line is shown. The rate of acceleration and deceleration is constant and it is equal to 5 ms^(-2) . If the average velocity during the motion is 20 ms^(-1) , then the value of t is

The velocity –position graph of a particle moving along a straight line is shown. Then acceleration of the particle at s = 15 m is :

The velocity displacement graph of a particle moving along a straight line is shown in figure. Then the acceleration displacement graph is.

The velocity -time (v - t) graph of a particle moving in a straight line is shown in figure. The acceleration of the particle at t = 9 is:

The velocity - displacement graph of a particle moving along a straight line is shown The most suitable acceleration - displacement graph will be

CENGAGE PHYSICS-KINEMATICS-1-Linked Comprehension
  1. A body is allowed to fall from a height of 10 m. If the time taken for...

    Text Solution

    |

  2. A body is allowed to fall from a height of 10 m. If the time taken for...

    Text Solution

    |

  3. A body is dropped from a balloon moving up with a velocity of 4 m s^(-...

    Text Solution

    |

  4. A body is dropped from a balloon meving up wigh a velocity of 4 m s^(-...

    Text Solution

    |

  5. A bus starts moving with acceleration 2 ms^-2. A cyclist 96 m behind t...

    Text Solution

    |

  6. A bus starts moving with acceleration 2 ms^(-2). A cyclist 96 m behind...

    Text Solution

    |

  7. A car is moving towards south with a speed of 20 m s^(-1). A motorcycs...

    Text Solution

    |

  8. A car is moving towards south with a speed of 20 m s^(-1). A motorcycs...

    Text Solution

    |

  9. Two particles A and B are initially 40 m apart, A is behind B. Particl...

    Text Solution

    |

  10. Two particles A and B are initially 40 mapart, A is behind B. Particl...

    Text Solution

    |

  11. The velocity-time graph of a particle in straight line motion is veloc...

    Text Solution

    |

  12. The velocity-time graph of a particle in straight line motion is veloi...

    Text Solution

    |

  13. The velocity-time graph of a particle in straight line motion is veloi...

    Text Solution

    |

  14. The velocity-time graph of a particle moving along a straight line is ...

    Text Solution

    |

  15. The velocity-time graph of a particle moving along a straight line is ...

    Text Solution

    |

  16. The velocity-time graph of a particle moving along a straight line is ...

    Text Solution

    |

  17. Sundy the four graphs given below. Answer the follwing questions on th...

    Text Solution

    |

  18. Sundy the four graphs given below. Answer the follwing questions on th...

    Text Solution

    |

  19. Study the following graph: The particle is moving with constant ...

    Text Solution

    |

  20. Study the following graph: The particle has negative acceleration...

    Text Solution

    |