


Similar Questions
Explore conceptually related problems
Recommended Questions
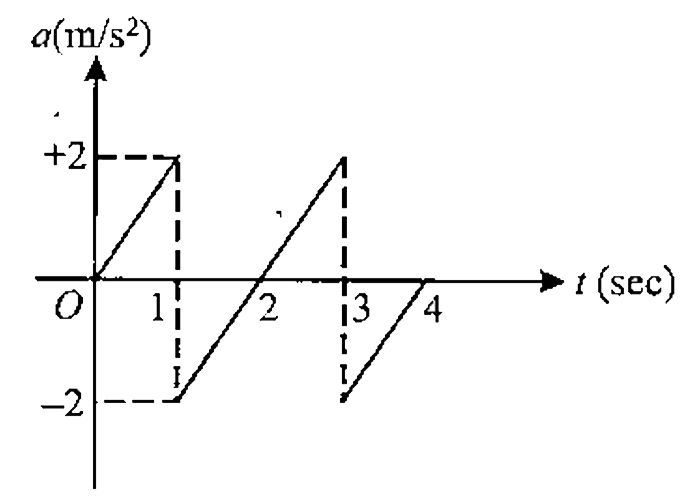
- Acceleration vs time graph is shown in the figure for a particle movin...
Text Solution
|
- The acceleration-time graph of a particle moving along a straight line...
Text Solution
|
- The figure shows a velocity-time graph of a particle moving along a st...
Text Solution
|
- For a particle moving on a straight lint the variation of acceleration...
Text Solution
|
- Acceleration vs time graph for a particle moving along a straight line...
Text Solution
|
- Acceleration vs time graph is shown in the figure for a particle movin...
Text Solution
|
- A particle is moving in a straight line. Particle was initially at res...
Text Solution
|
- A particle starts moving from rest in a from rest in a straight line. ...
Text Solution
|
- The acceleration-time graph of a particle moving along a straight line...
Text Solution
|