


Similar Questions
Explore conceptually related problems
Recommended Questions
- Study the graph given below and answer the questions that follow : ...
Text Solution
|
- The population growth is generally described by the following equation...
Text Solution
|
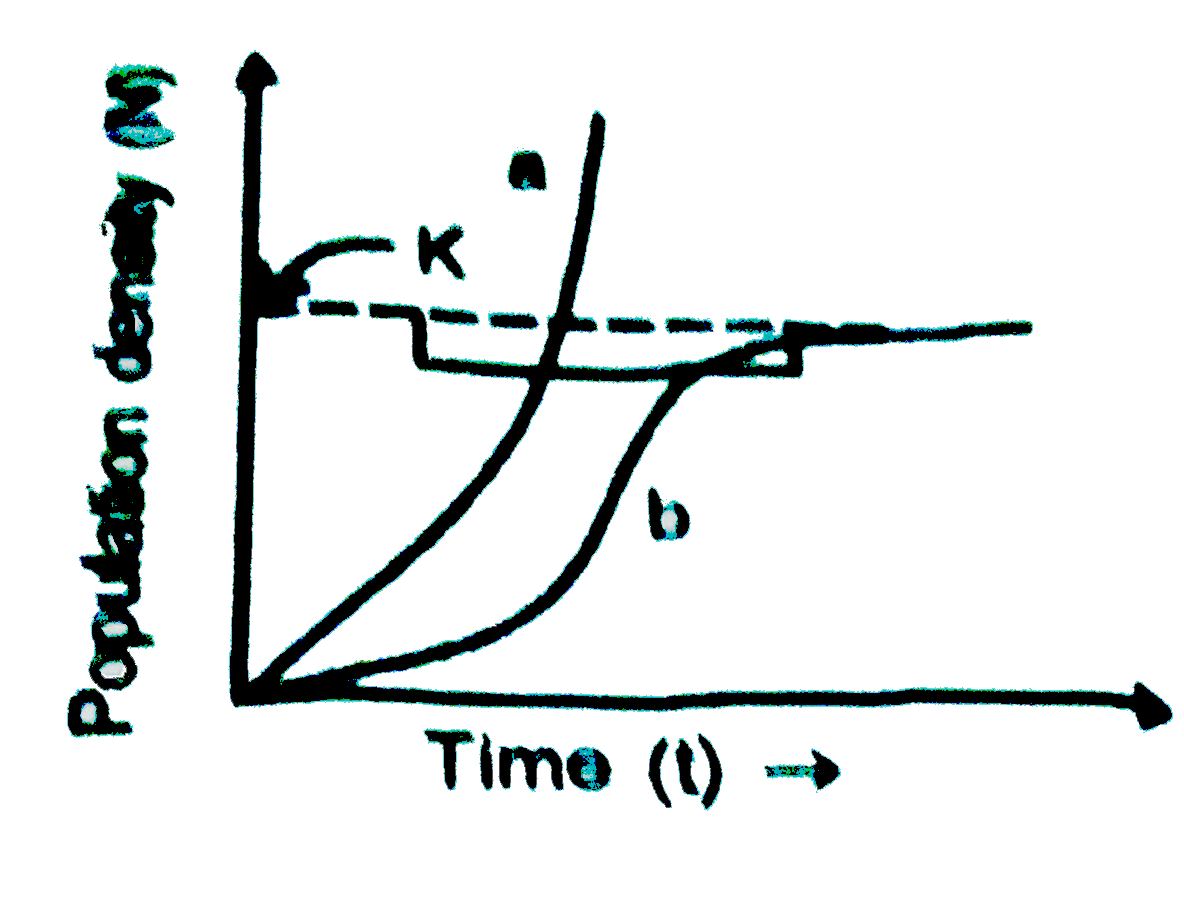
- Study the population growth curves in the graph given below and answer...
Text Solution
|
- Study the graph given below and answer the questions that follow : (i)...
Text Solution
|
- The Verhulst-Pearl logistic growth is described to the equation (dN)/(...
Text Solution
|
- What do you mean by 'r' and 'K' in Verhulst - Pearl logistic growth cu...
Text Solution
|
- जनसंख्या के विकास को सामान्यत: निम्न समीकरण द्वारा वर्णित किया जाता है...
Text Solution
|
- In the equation, dN//dt = rN (K-N // N), r,K,N stand for what?
Text Solution
|
- Study the population growth curves in the graph given below and answer...
Text Solution
|