


Topper's Solved these Questions
ALGEBRA MARCH 2015
GURUKUL PUBLICATION - MAHARASHTRA PREVIOUS YEAR PAPERS|Exercise Attempt any three of the following sub-questions:|5 VideosALGEBRA JULY 2017
GURUKUL PUBLICATION - MAHARASHTRA PREVIOUS YEAR PAPERS|Exercise QUESTIONS|22 VideosALGEBRA MARCH 2016
GURUKUL PUBLICATION - MAHARASHTRA PREVIOUS YEAR PAPERS|Exercise Attempt any two of the following subquestions :|3 Videos
Similar Questions
Explore conceptually related problems
GURUKUL PUBLICATION - MAHARASHTRA PREVIOUS YEAR PAPERS-ALGEBRA MARCH 2015-Attempt any two of the following sub-questions:
- Two digit numbers are formed using the digits 0, 1, 2, 3, 4, 5 where d...
Text Solution
|
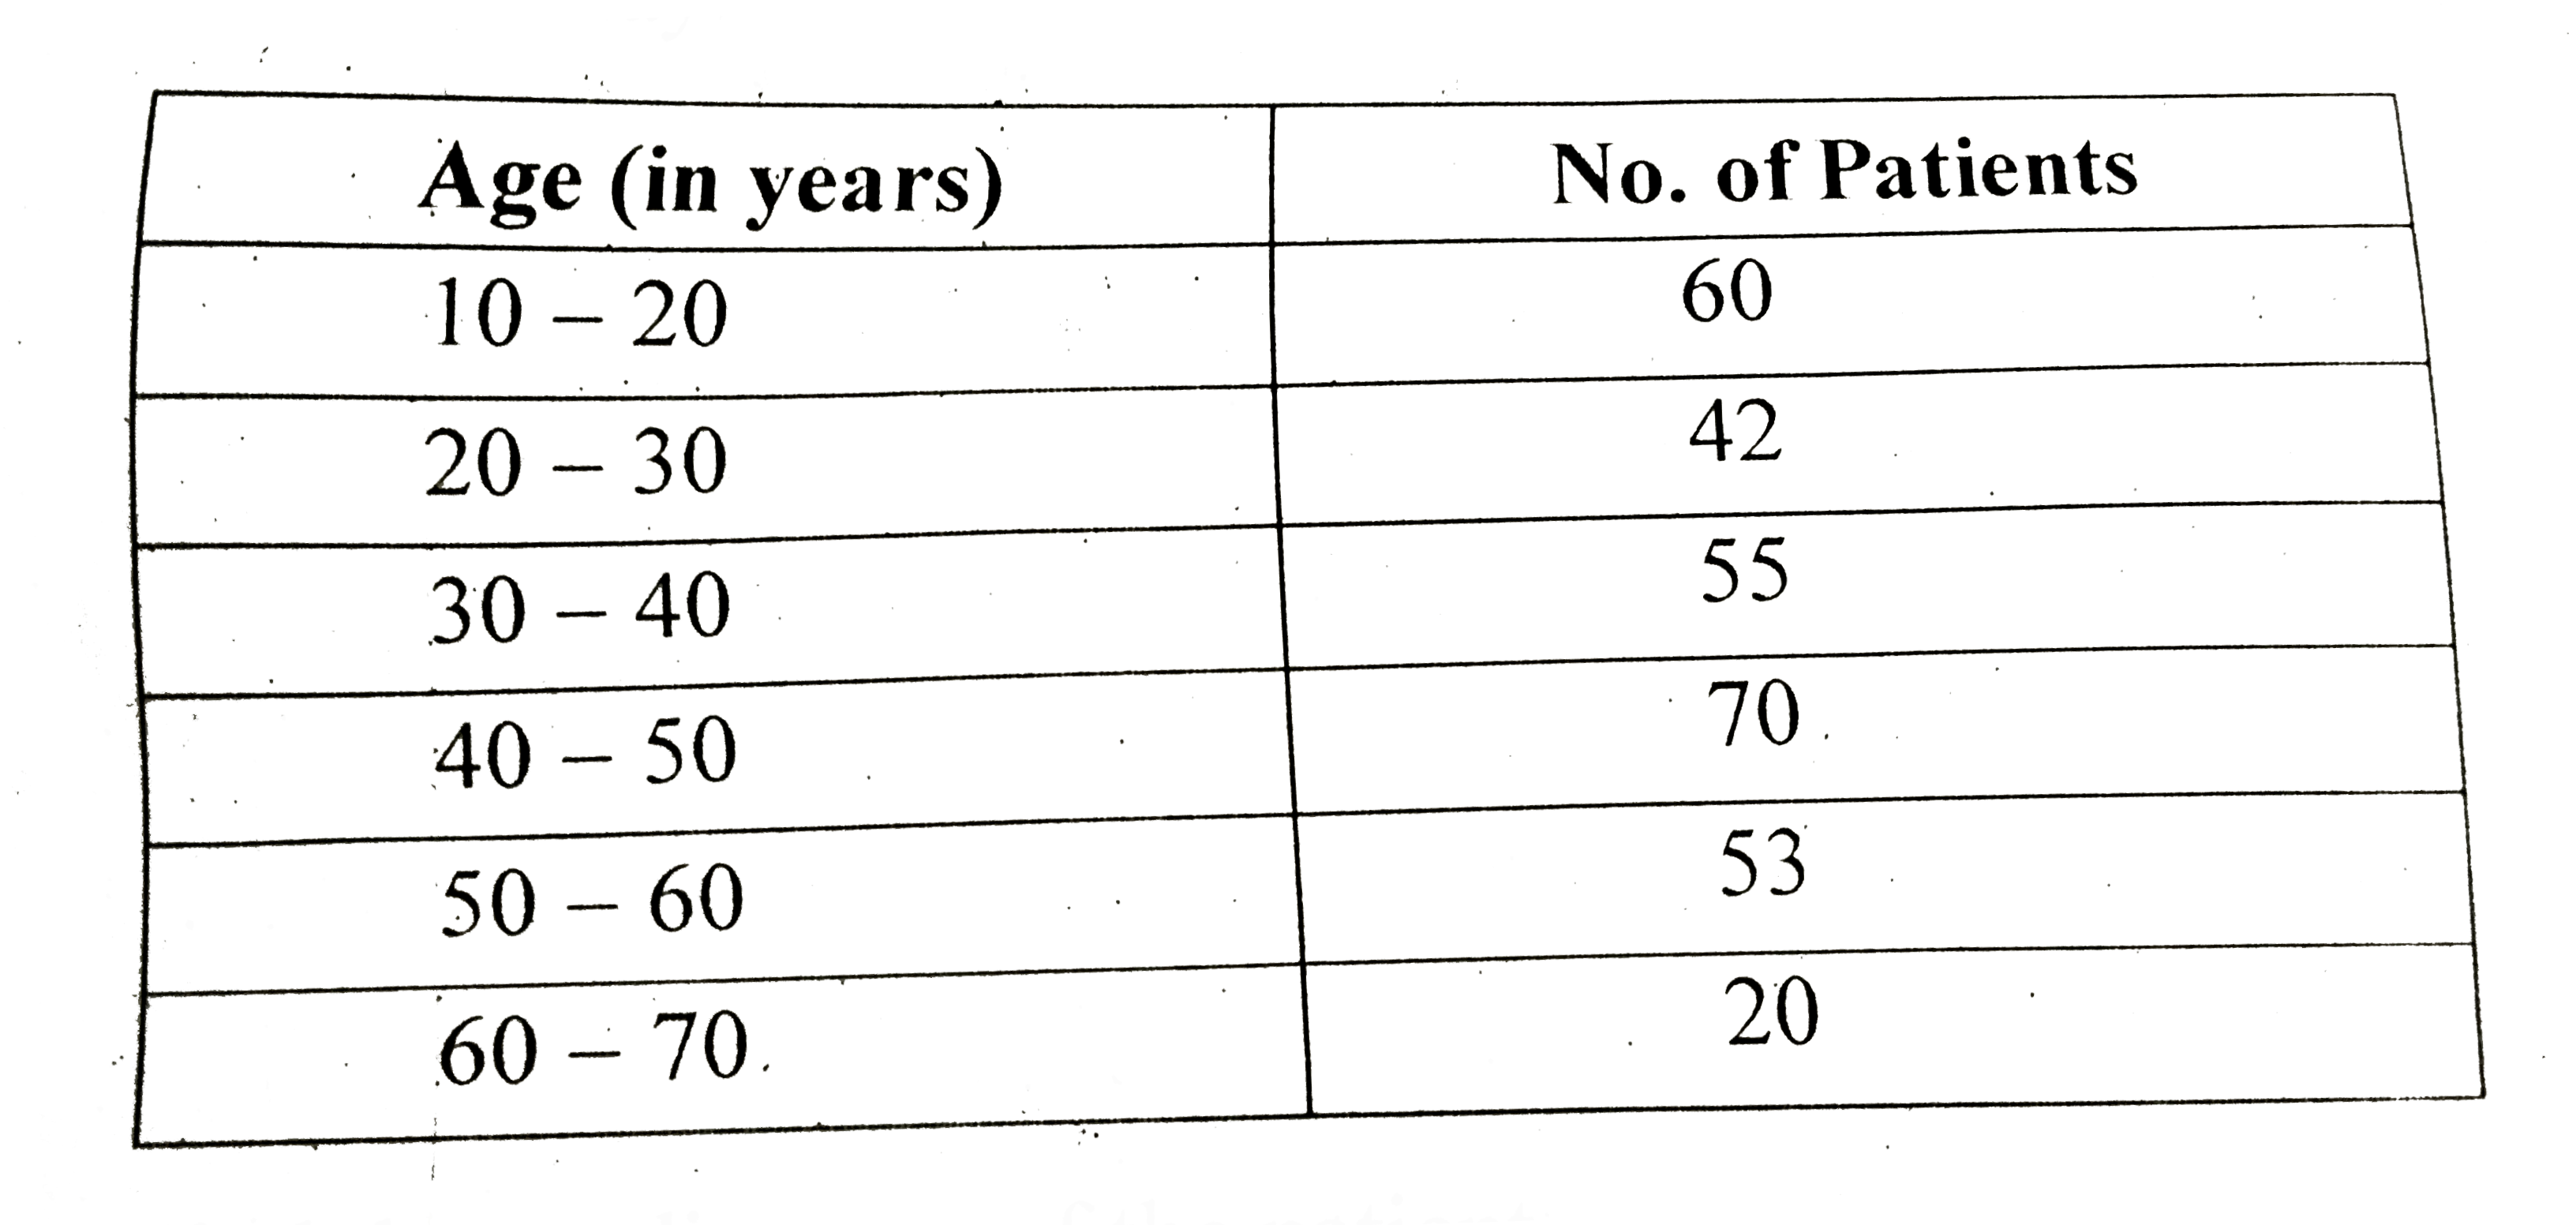
- The following table shows ages of 300 patients getting medical treatme...
Text Solution
|
- If alpha+beta=5 and alpha^(3) +beta^(3)=35, find the quadratic equatio...
Text Solution
|
- Babubhai borrows Rs. 4,000 and agrees to repay with a total interest o...
Text Solution
|
- On the first day of the sale of tickets of a drama, in all 35 tickets ...
Text Solution
|
- Given below is the frequency distribution of driving speeds (in km/hou...
Text Solution
|