


Topper's Solved these Questions
ALGEBRA MARCH 2019
GURUKUL PUBLICATION - MAHARASHTRA PREVIOUS YEAR PAPERS|Exercise Solve the following questions (Any three):|4 VideosALGEBRA MARCH 2018
GURUKUL PUBLICATION - MAHARASHTRA PREVIOUS YEAR PAPERS|Exercise Attempt any two of the following subquestions:|6 VideosGEOMETRY JULY 2017
GURUKUL PUBLICATION - MAHARASHTRA PREVIOUS YEAR PAPERS|Exercise Solve any two sub-questions:|5 Videos
Similar Questions
Explore conceptually related problems
GURUKUL PUBLICATION - MAHARASHTRA PREVIOUS YEAR PAPERS-ALGEBRA MARCH 2019-Solve the following questions (Any one):
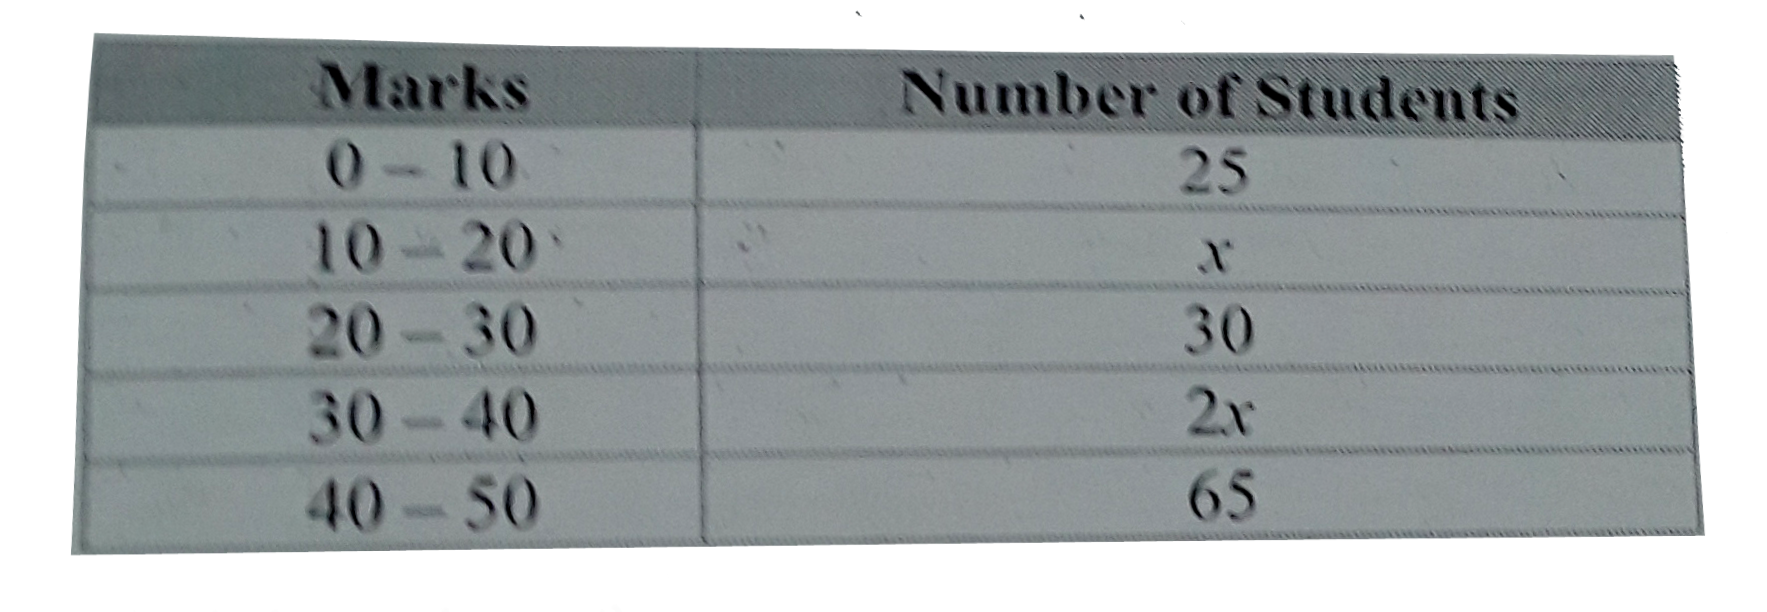
- The following frequency distbution table shows marks obtained b...
Text Solution
|
- Two taps tpgether can fill a tank completely in 3 (1) /(13) ...
Text Solution
|
- The Co-ordinations of the point of intersection of lines ax + b...
Text Solution
|
- The following frequency distribution table shows the distances ...
Text Solution
|