A

B
C

D
Text Solution
Verified by Experts
The correct Answer is:


Similar Questions
Explore conceptually related problems
Recommended Questions
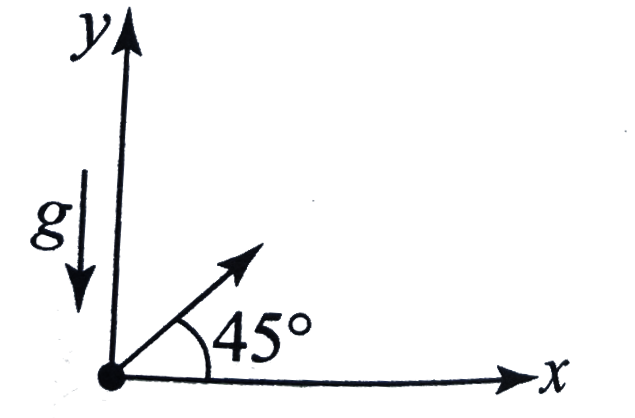
- A stone is projected at an angle 45^@ with horizontal above horizontal...
Text Solution
|
- A stone is projected at an angle 45^@ with horizontal above horizontal...
Text Solution
|
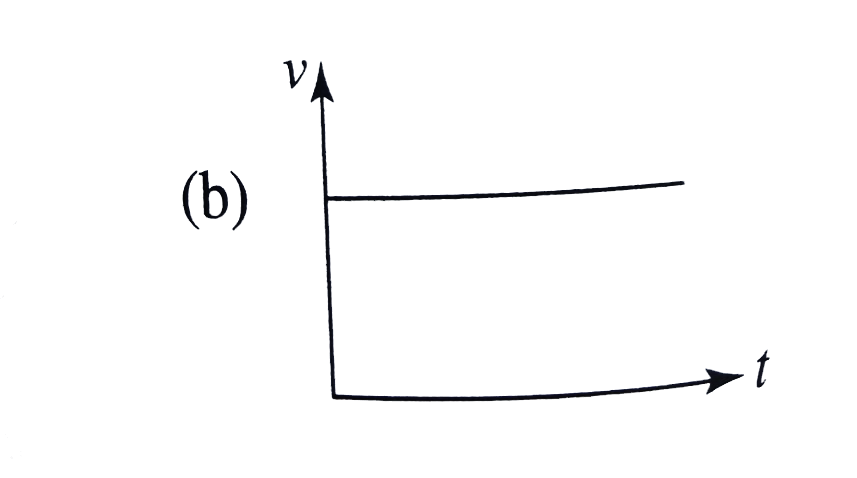
- Figure shows (vx ,t) and (vy ,t) diagram for a body of unit mass. Find...
Text Solution
|
- A stone is projected at angle 45^(@) with the horizontal (x- axis) as ...
Text Solution
|
- A projectill is projected at an angle (alpha gt 45^(@)) with an initia...
Text Solution
|
- Draw a velocity versus time graph of a stone thrown vertically upwards...
Text Solution
|
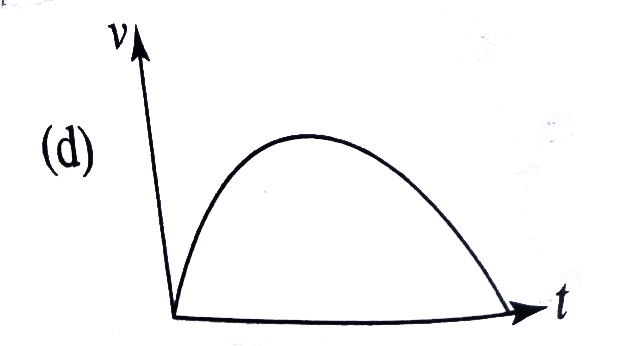
- If vx and vy are the components of instantaneous velocity, then repres...
Text Solution
|
- The graph in figure shows the velocity v versus time t for a body. Whi...
Text Solution
|
- Position (x) versus time (t) graph of a particle is as shown. The velo...
Text Solution
|