


Similar Questions
Explore conceptually related problems
Recommended Questions
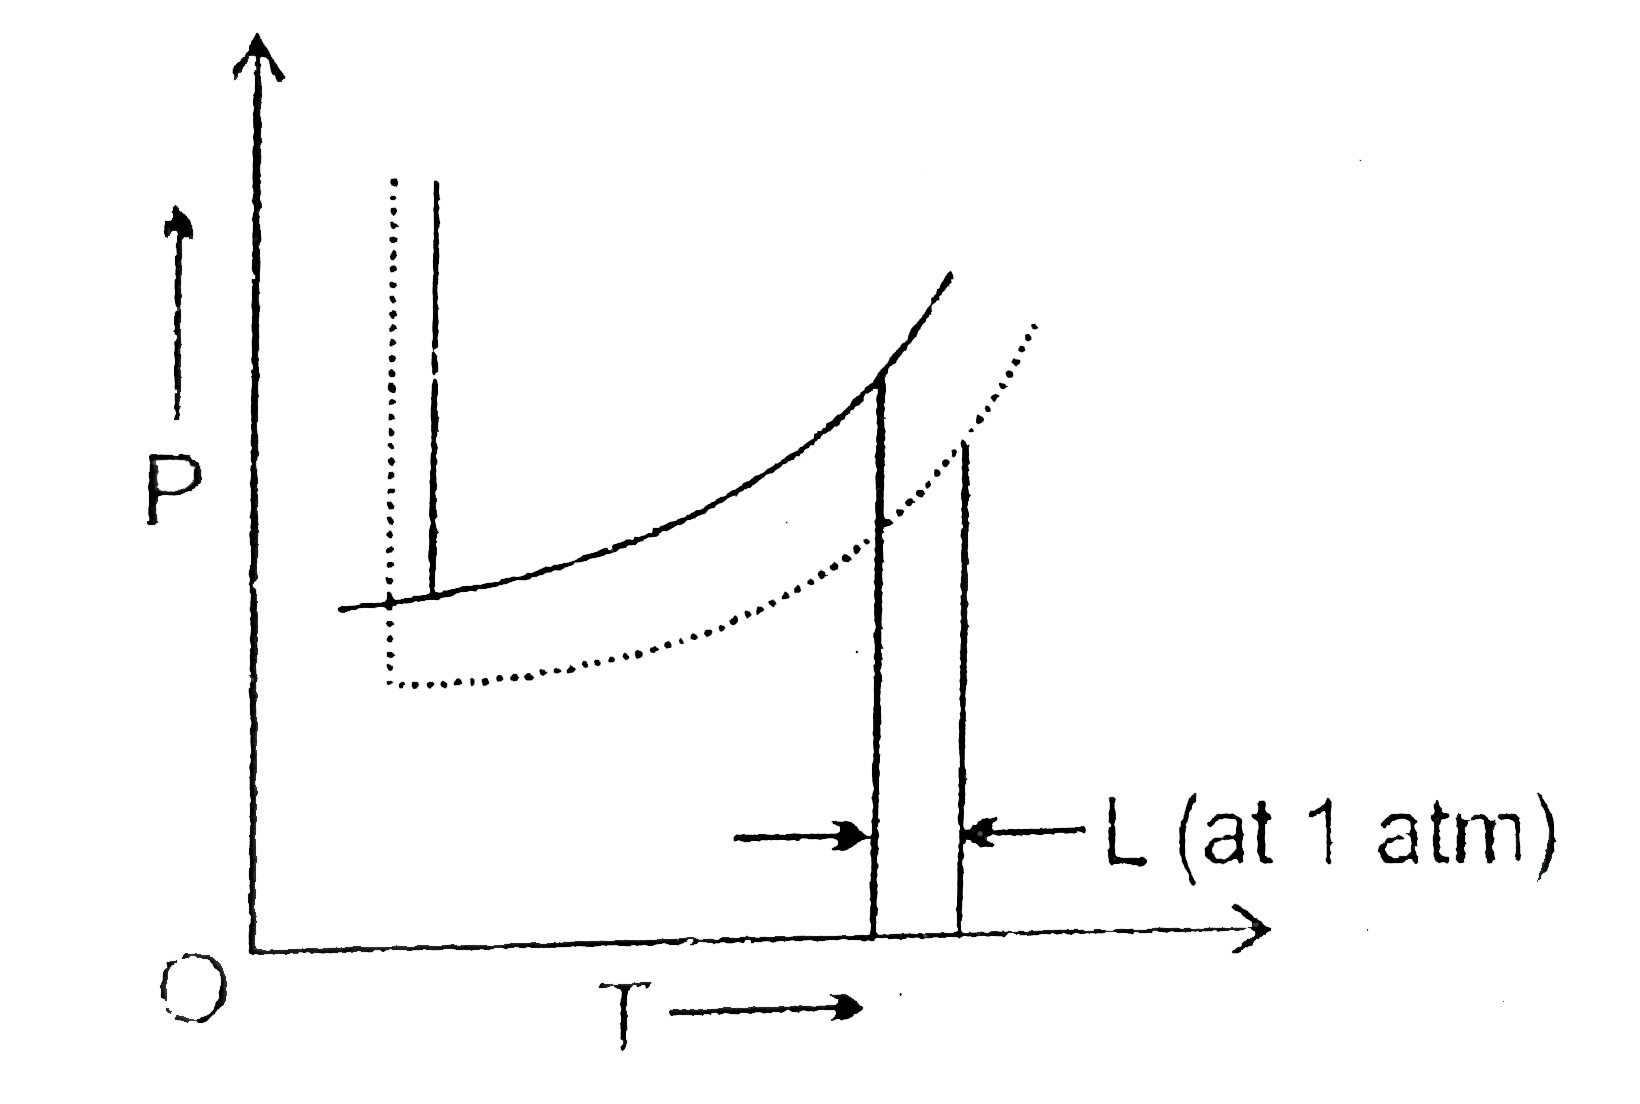
- The phase diagrams for the pure solvent (solid lines) and the solution...
Text Solution
|
- The vapour pressure (VP) of a dilute solution of non-volatile solute i...
Text Solution
|
- With the help a neat diagram indicate why the solution of a non-volati...
Text Solution
|
- The phase diagrams for the pure solvent (solid lines) and the solution...
Text Solution
|
- For which property is the value greater for a solution of a non-volati...
Text Solution
|
- When non-volatile solute is assed to a pure solvent, the:
Text Solution
|
- The phase diagrams for the pure solvent (solid lines) and the solution...
Text Solution
|
- Addition of a non-volatile solute in a volatile ideal solvent
Text Solution
|
- There are two beakers (I) having pure volatile solvent and (II) having...
Text Solution
|