


Similar Questions
Explore conceptually related problems
Recommended Questions
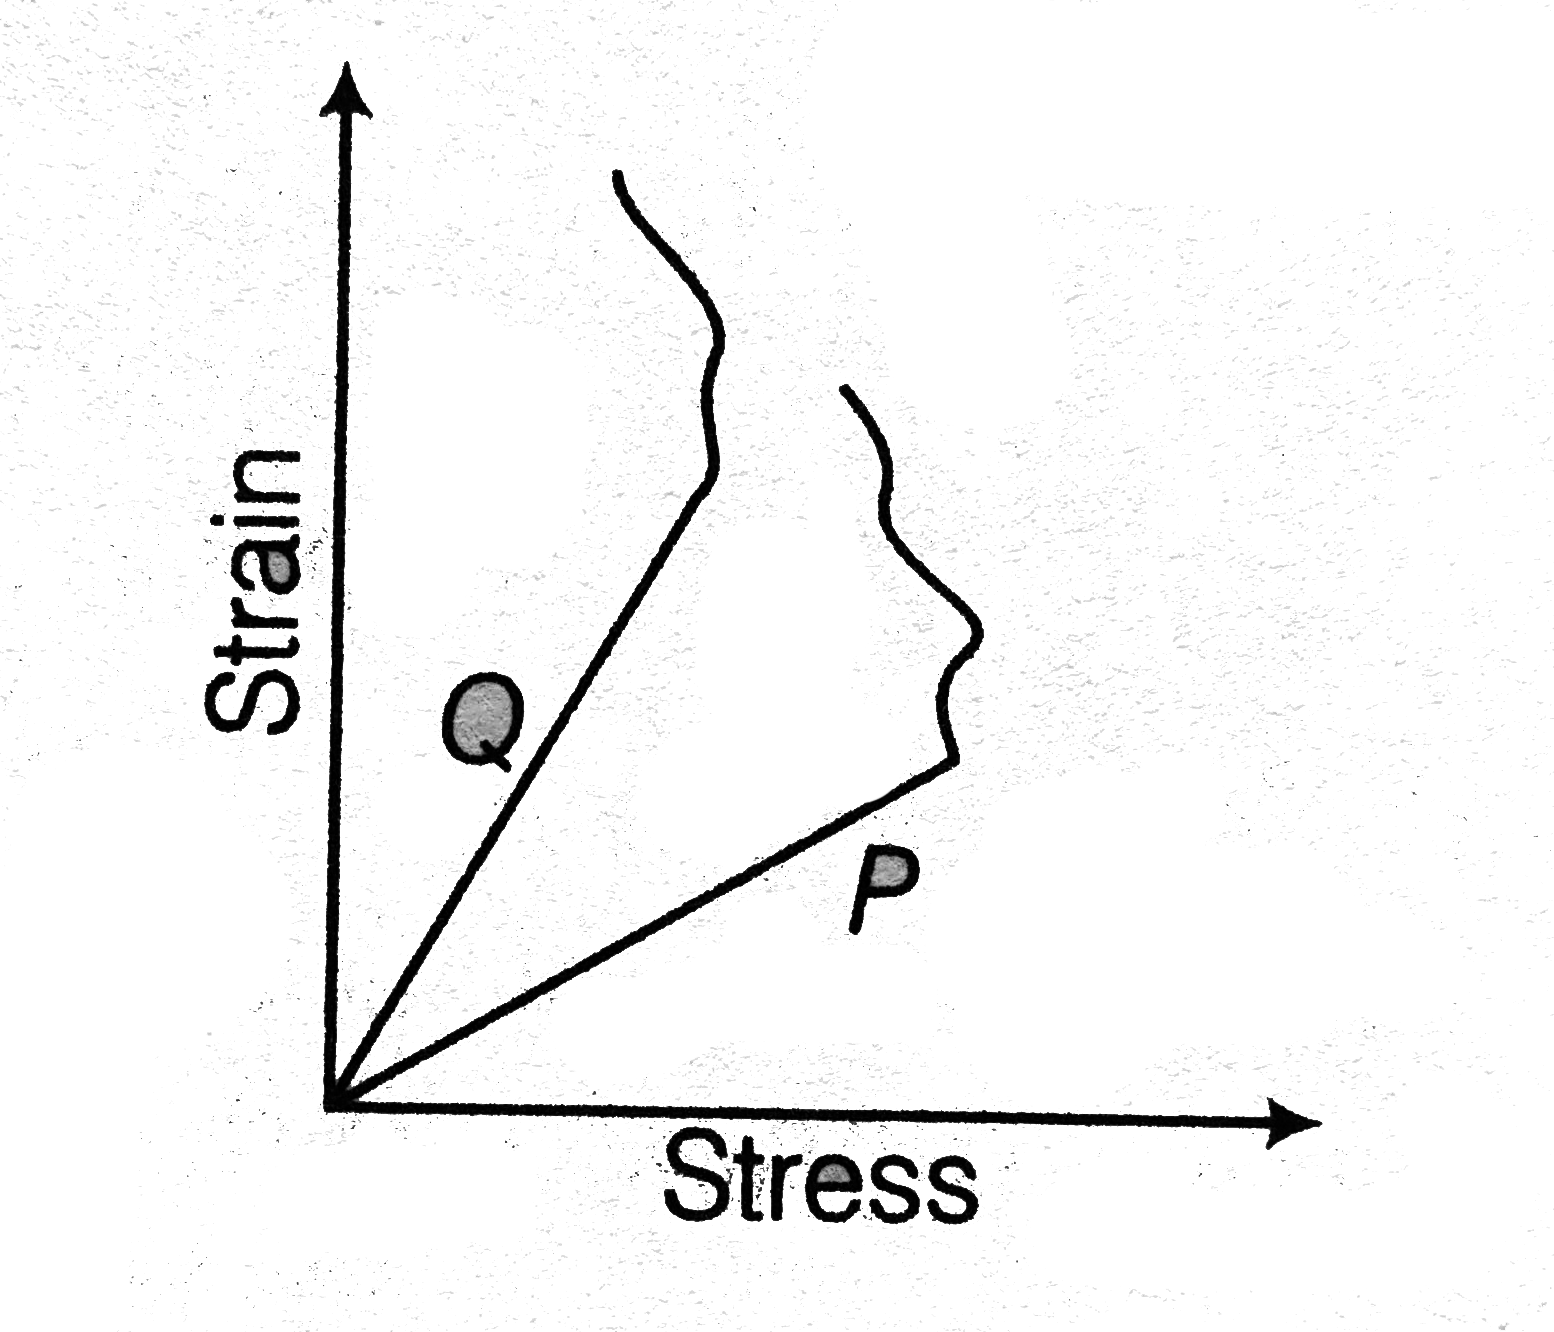
- Figure shows the stress-strain curve of two metals P and Q . From the ...
Text Solution
|
- Figure shows the stress-strain curve of two metals P and Q . From the ...
Text Solution
|
- Figure shows the stress-strain graphs for materials . A and B . From t...
Text Solution
|
- Figure shows the strain stress curve for a given material. The Young's...
Text Solution
|
- In plotting stress versus strain curves for two material P and Q, a st...
Text Solution
|
- The graph given is a stress-strain curve for
Text Solution
|
- The strain-stress curves of three wire of different materials are show...
Text Solution
|
- The strain-stress curves of three wires of different materials ar show...
Text Solution
|
- Plot a stress to strain curve for a metal and explain.
Text Solution
|