


Similar Questions
Explore conceptually related problems
Recommended Questions
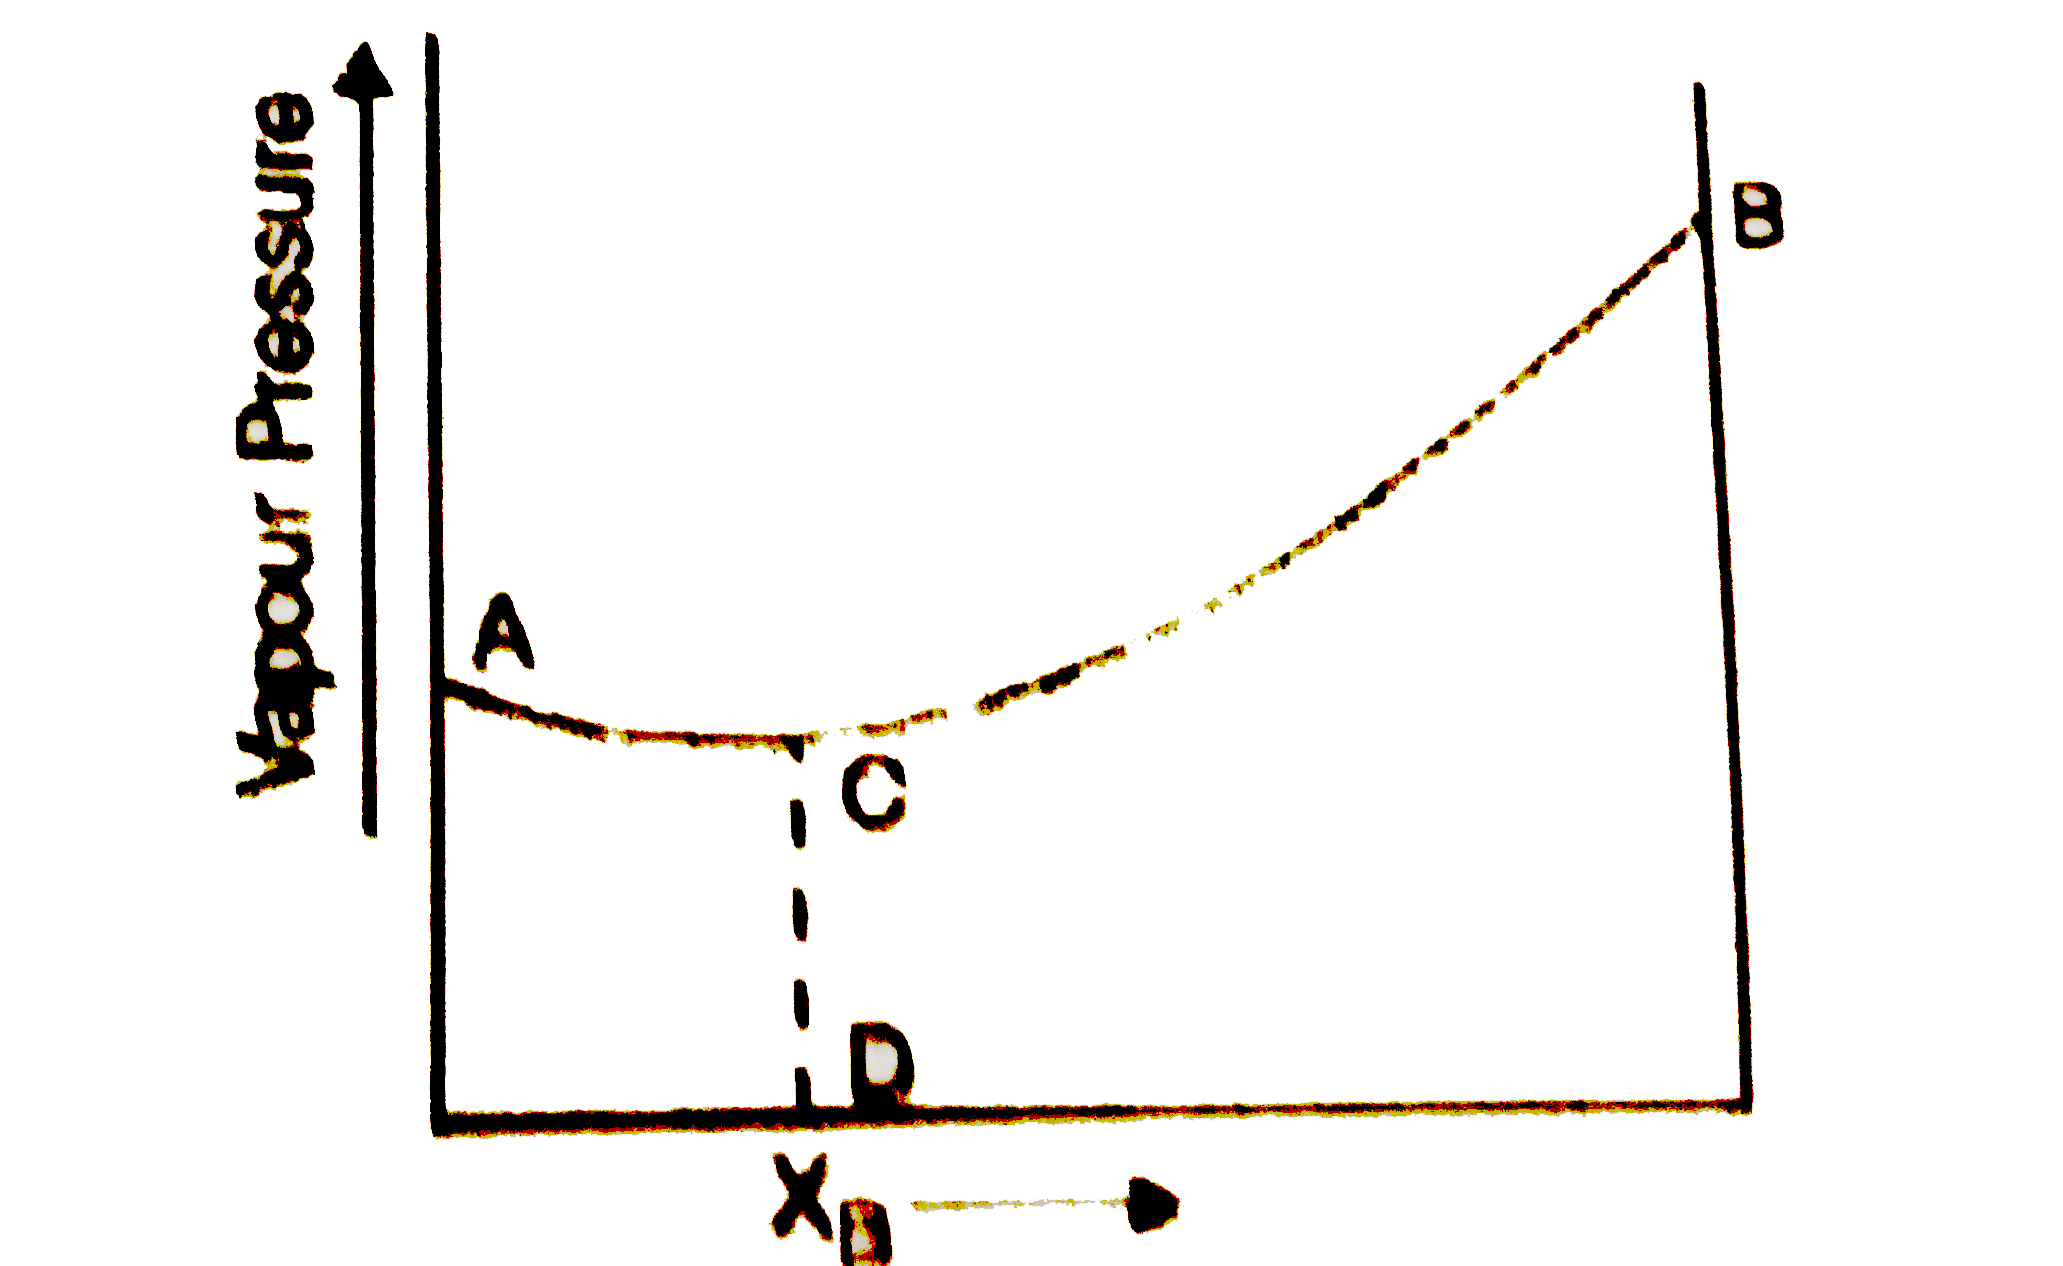
- The diagram given below is a vapour pressure composition diagram for a...
Text Solution
|
- The diagram given below is a vapour-pressure-composition diagram for a...
Text Solution
|
- The diagram given below represents boiling point composition diagram o...
Text Solution
|
- Draw a suitable diagram to express the relationship for ideal solutio...
Text Solution
|
- For a binary ideal liquid solution, the variation in total vapour pres...
Text Solution
|
- The diagram given below represents boiling point composition diagram o...
Text Solution
|
- For a binary ideal liquid solution, the variation total vapour pressur...
Text Solution
|
- The diagram given below is a vapour pressure composition diagram for a...
Text Solution
|
- किसी आदर्श विलयन के लिए वाष्प दाब तथा संघटन के चित्र (p-x आरेख) को आरे...
Text Solution
|