A
B
 .
.C
 .
.D
 .
.Text Solution
Verified by Experts
The correct Answer is:


Topper's Solved these Questions
GENERAL KINEMATICS AND MOTION IN ONE DIMENSION
A2Z|Exercise Assertion Reasoning|20 VideosGENERAL KINEMATICS AND MOTION IN ONE DIMENSION
A2Z|Exercise NEET Questions|37 VideosGENERAL KINEMATICS AND MOTION IN ONE DIMENSION
A2Z|Exercise Understanding Motion Through Graphs|40 VideosFLUID MECHANICS
A2Z|Exercise Chapter Test|29 VideosGRAVITATION
A2Z|Exercise Chapter Test|29 Videos
Similar Questions
Explore conceptually related problems
A2Z-GENERAL KINEMATICS AND MOTION IN ONE DIMENSION-Problem Based On Mixed Concepts
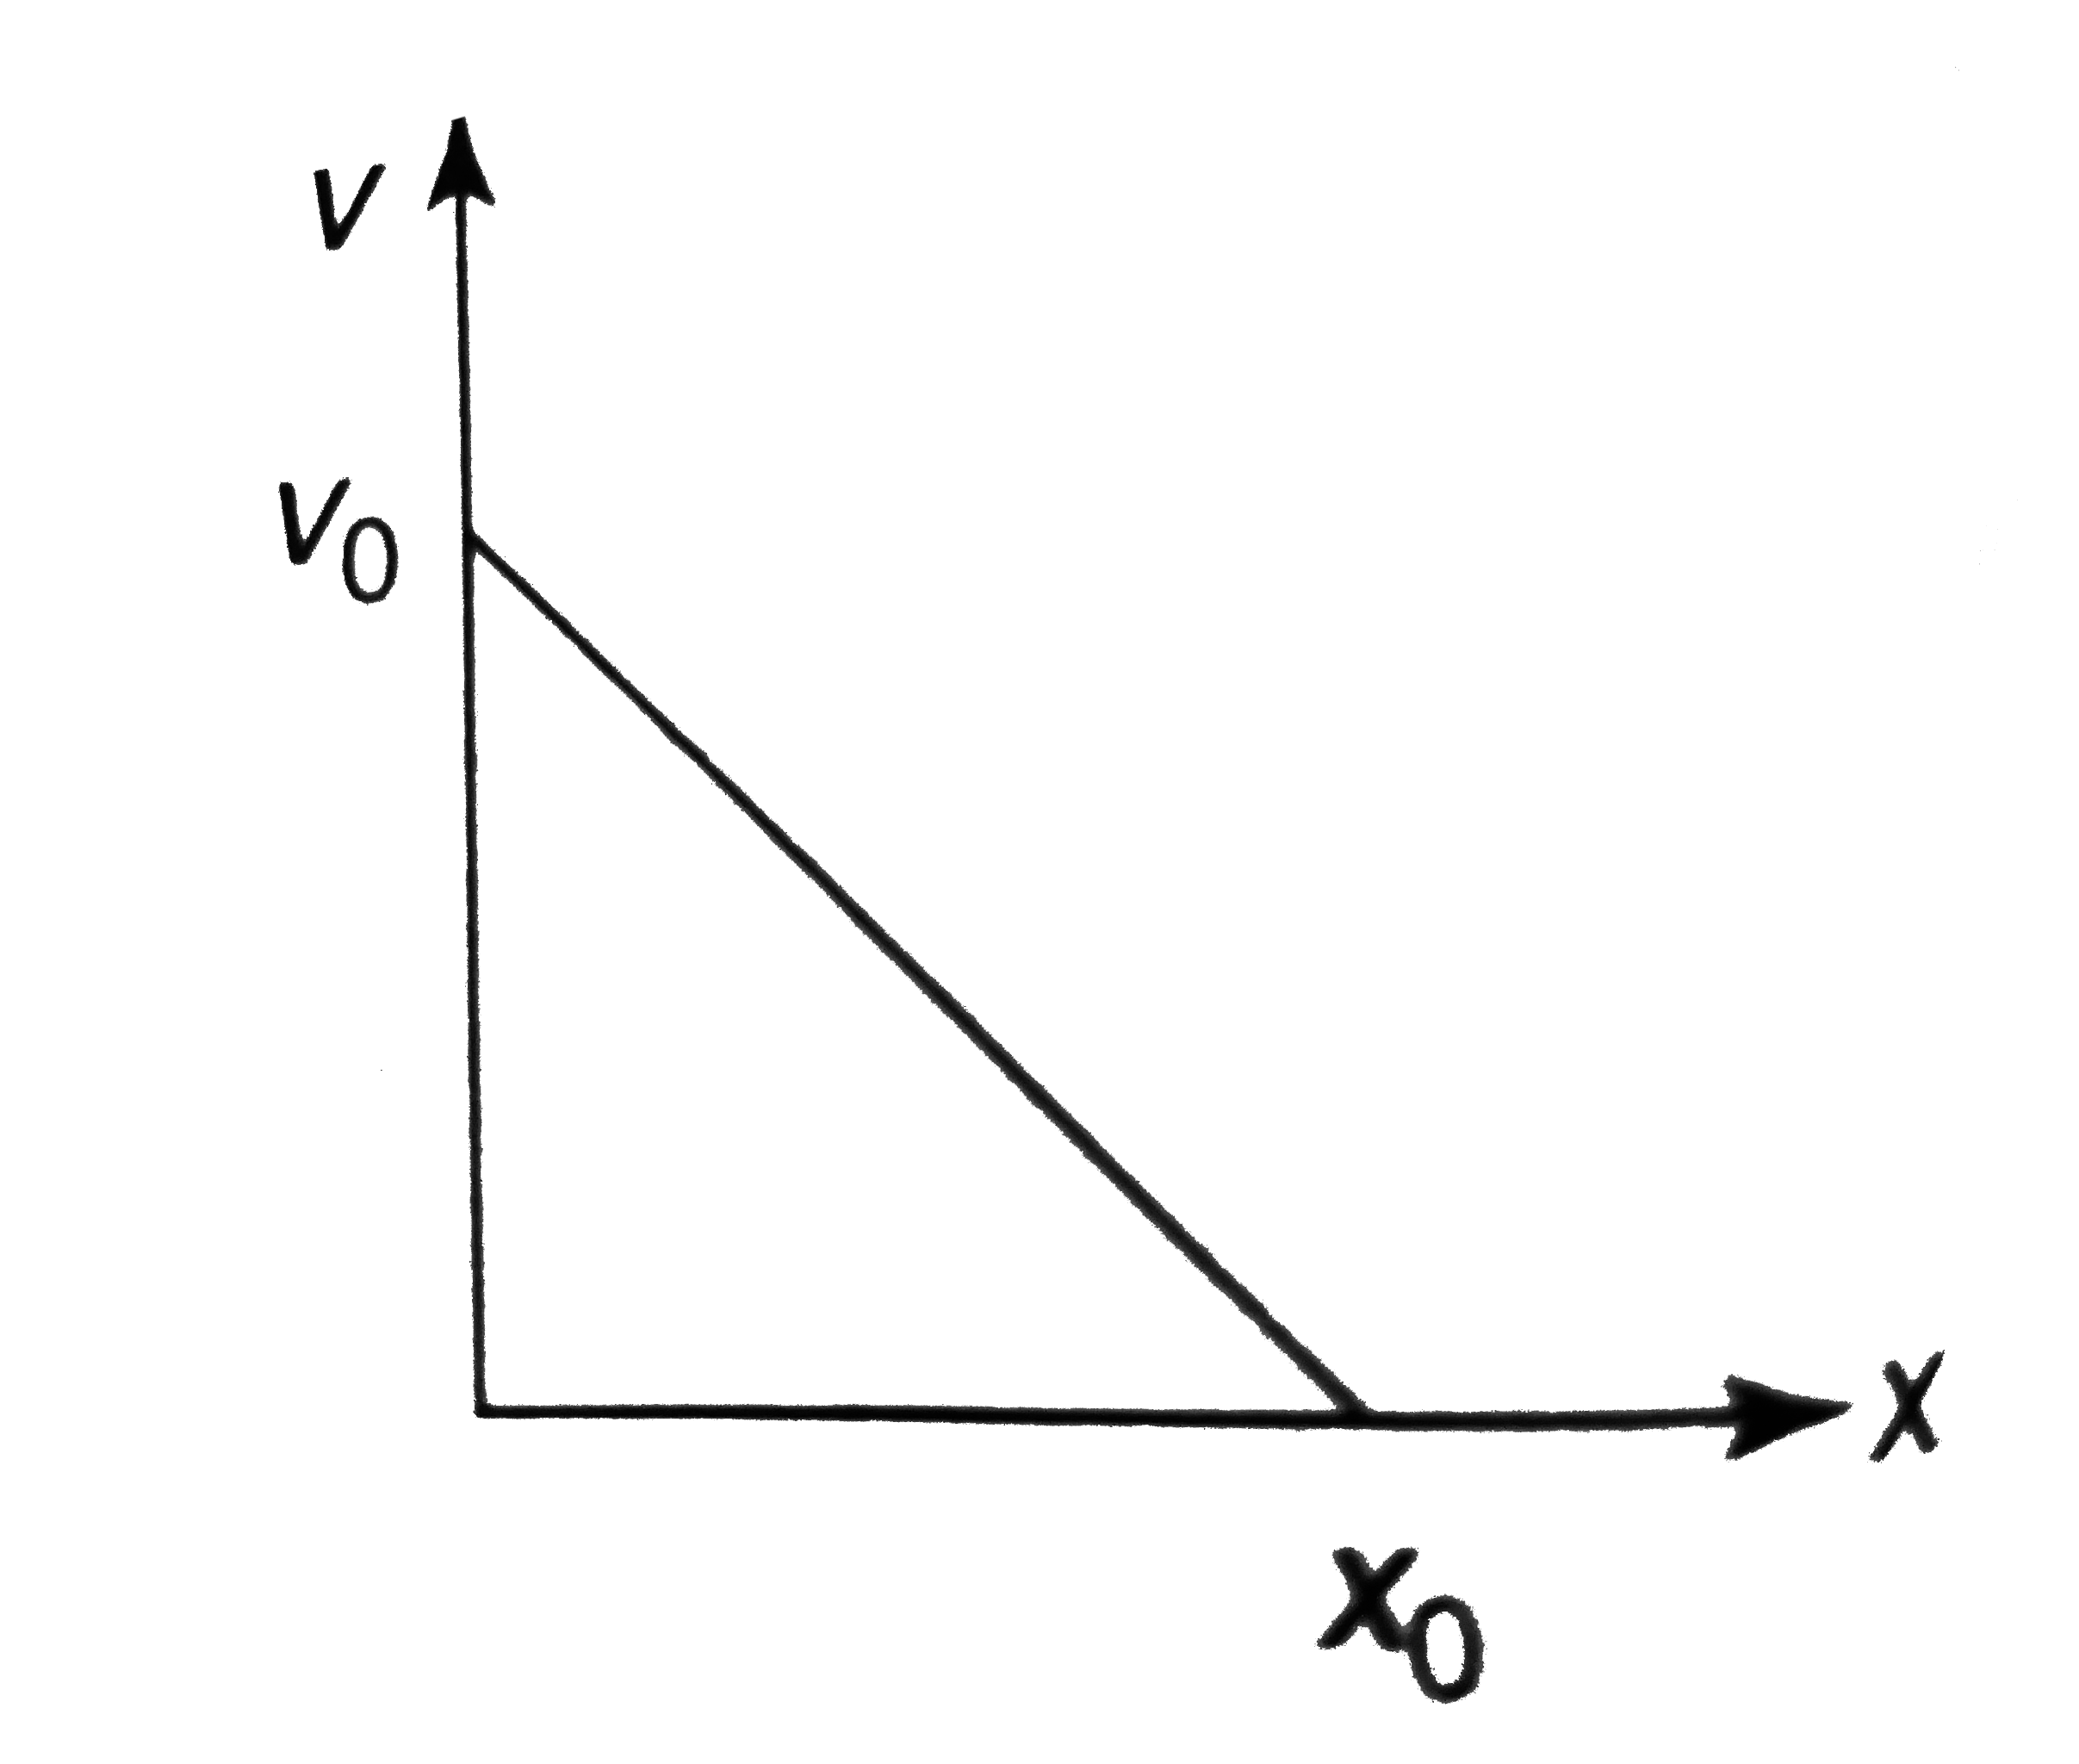
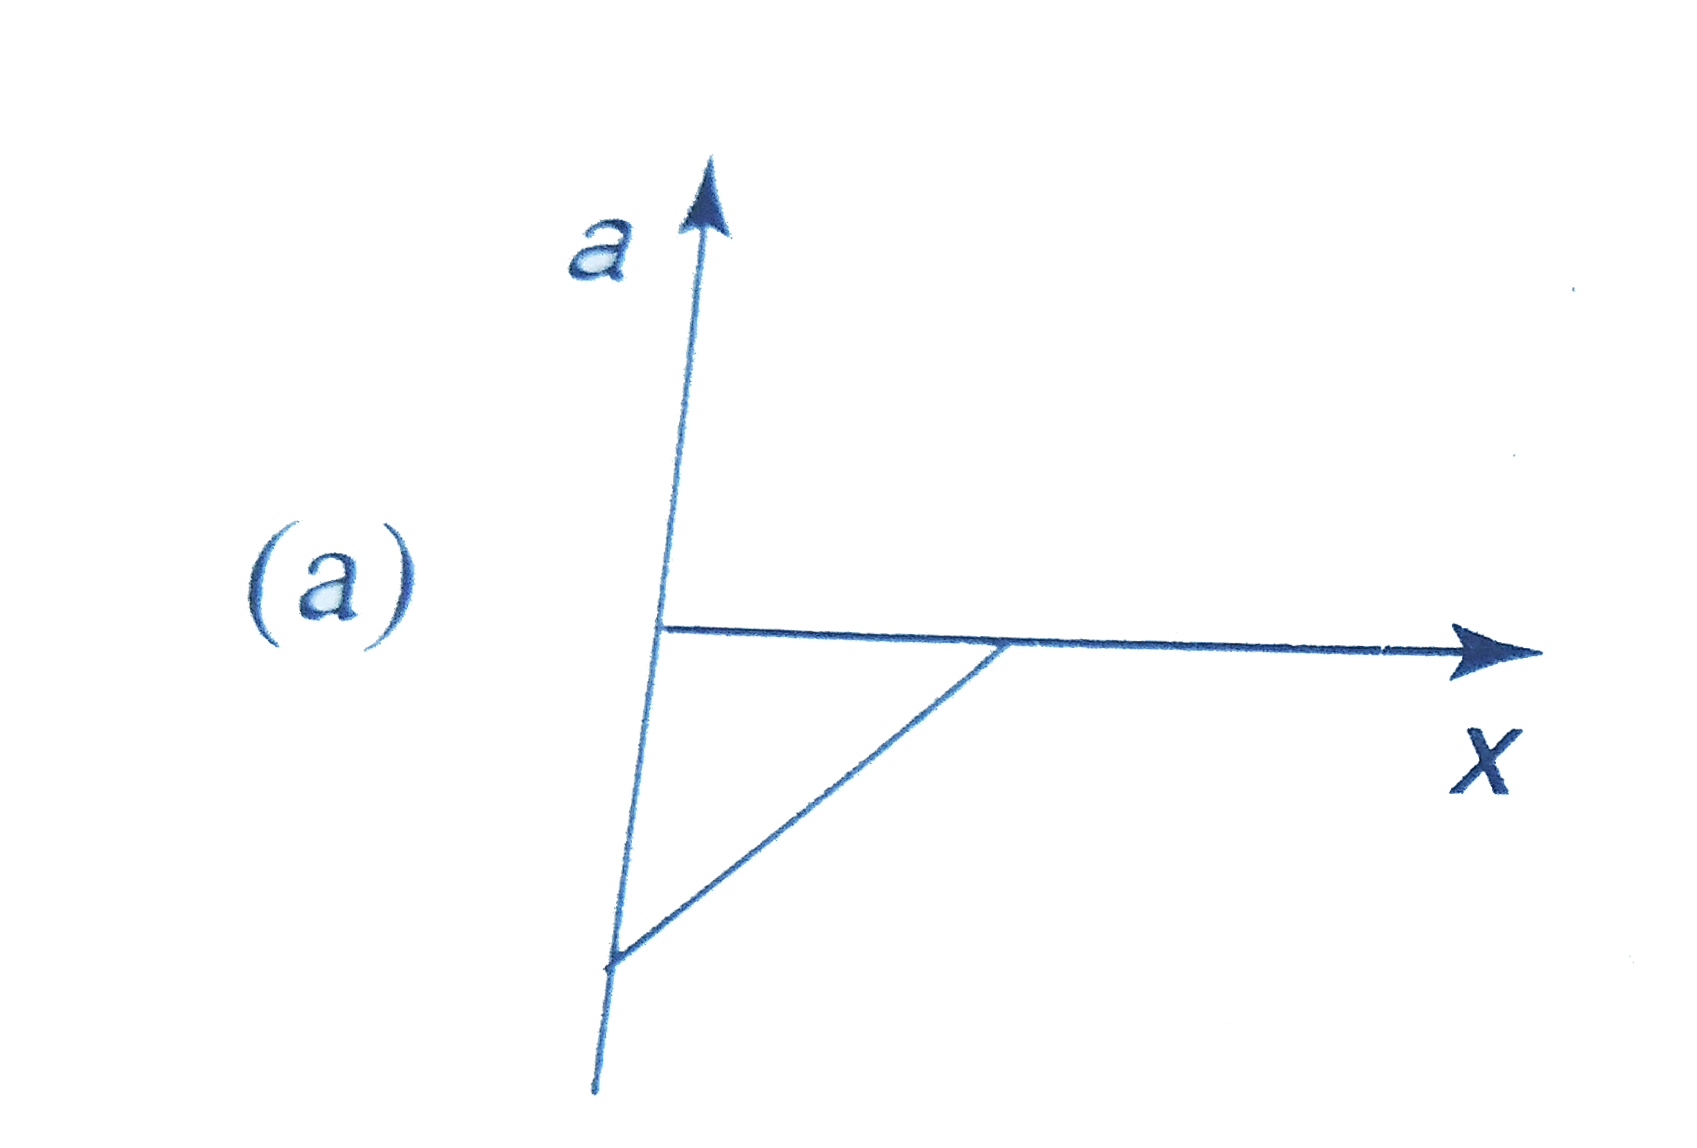
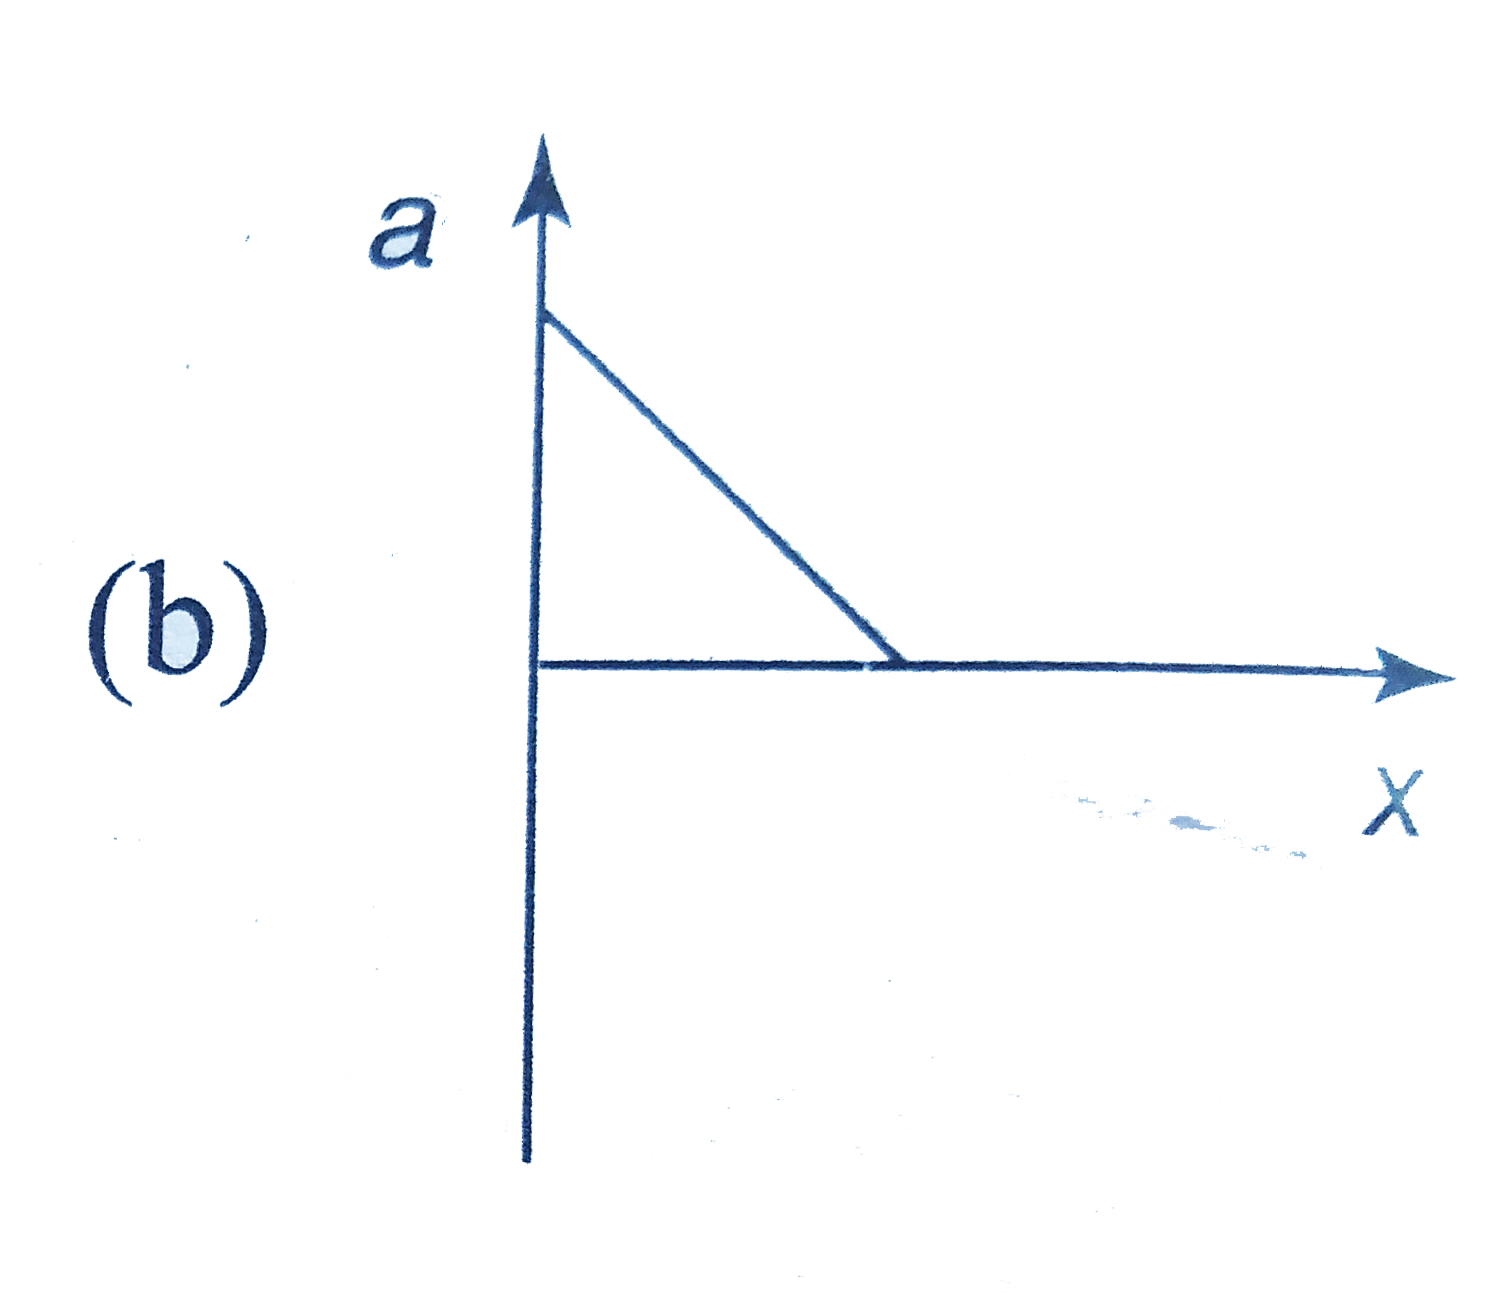
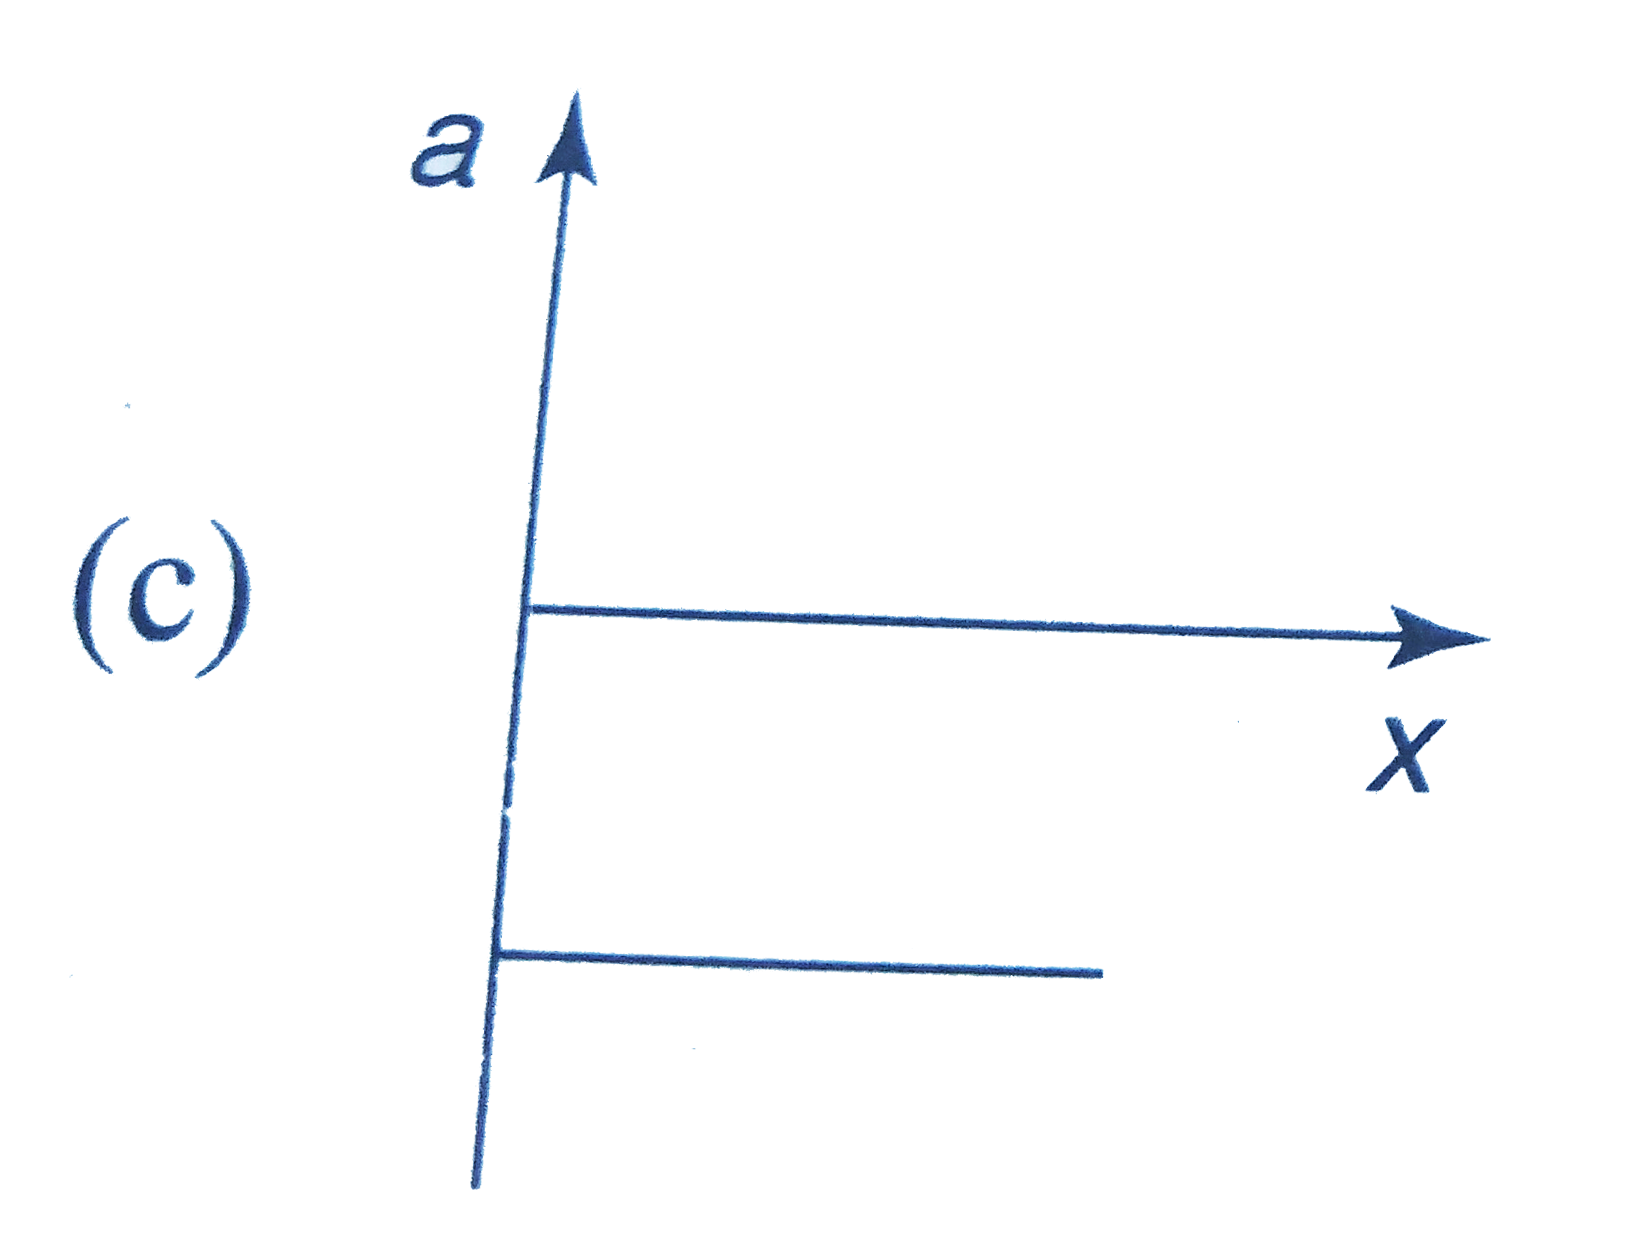
- The given graph shows the variation of velocity with displacement. Whi...
Text Solution
|
- The displacement of a particle is moving by x = (t - 2)^2 where x is i...
Text Solution
|
- A car is moving with uniform velocity 10 m//s. After t = 5 sec, brakes...
Text Solution
|
- Initially car A is 10.5 m ahead of car B. Both start moving at time t ...
Text Solution
|
- A ball is dropped vertically from a height d above the ground . It hit...
Text Solution
|
- The drawing shows velocity (v) versus time (t) graphs for two cyclists...
Text Solution
|
- A train normally travels at a uniform speed of 72 km//h on a long stre...
Text Solution
|
- Two objects moving along the same straight line are leaving point A wi...
Text Solution
|
- The speed v of a car moving on a straight road changes according to eq...
Text Solution
|
- When two bodies move uniformly towards each other, the distance betwee...
Text Solution
|
- A particle is thrown upwards from ground. It experiences a constant re...
Text Solution
|
- A particle moving along a straight line with a constant acceleration o...
Text Solution
|
- A particle starts from rest with uniform acceleration and it's velocit...
Text Solution
|
- Two bikes A and B start from a point. A moves with uniform speed 40 m/...
Text Solution
|
- A parachutist after bailing out falls 50m without friction. When parac...
Text Solution
|
- Two stones are thrown up simultaneously from the edge of a cliff 240...
Text Solution
|
- The velocity of a particle is v = v0 + g t + ft^2. If its position is ...
Text Solution
|
- A body is at rest at x =0 . At t = 0, it starts moving in the posi...
Text Solution
|
- An object moving with a speed of 6.25 m//s, is deceleration at a rate ...
Text Solution
|
- Consider a rubber ball freely falling from a height h = 4.9 m onto a ...
Text Solution
|