A
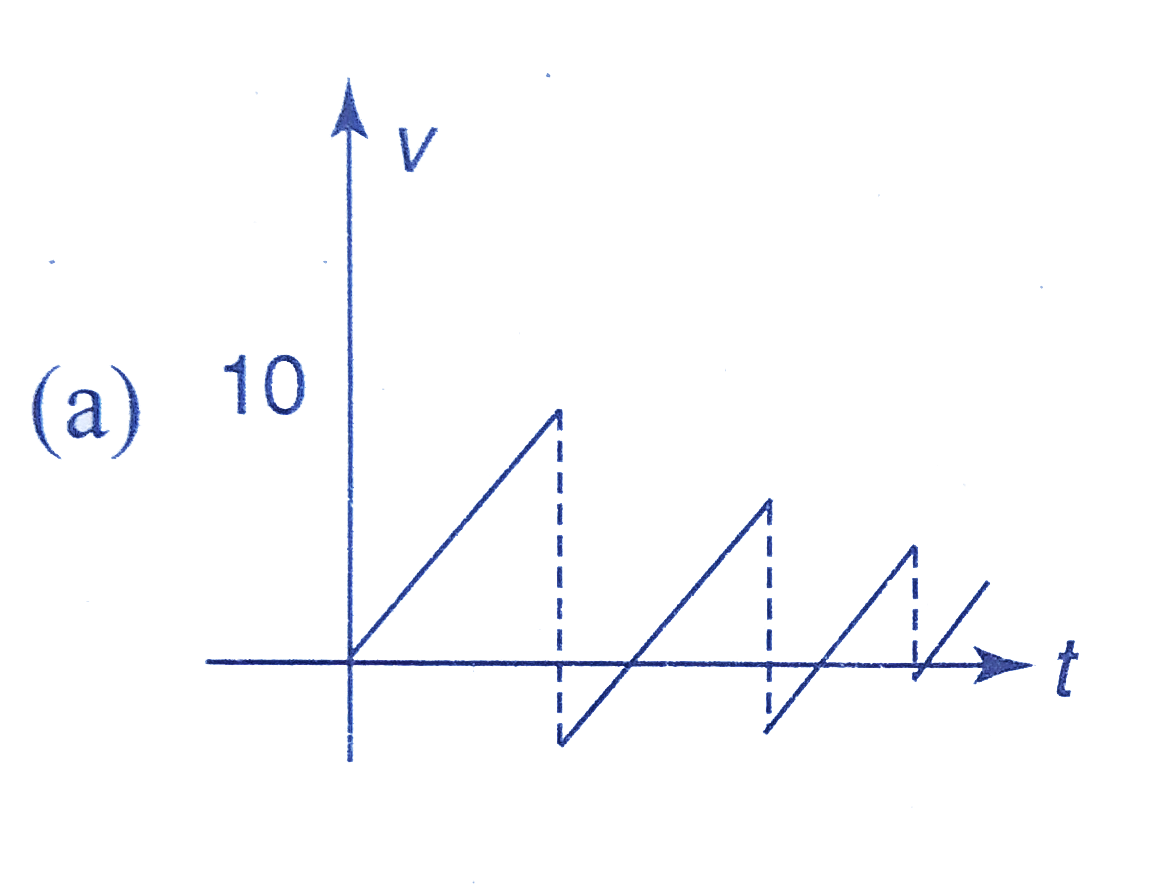 .
.B
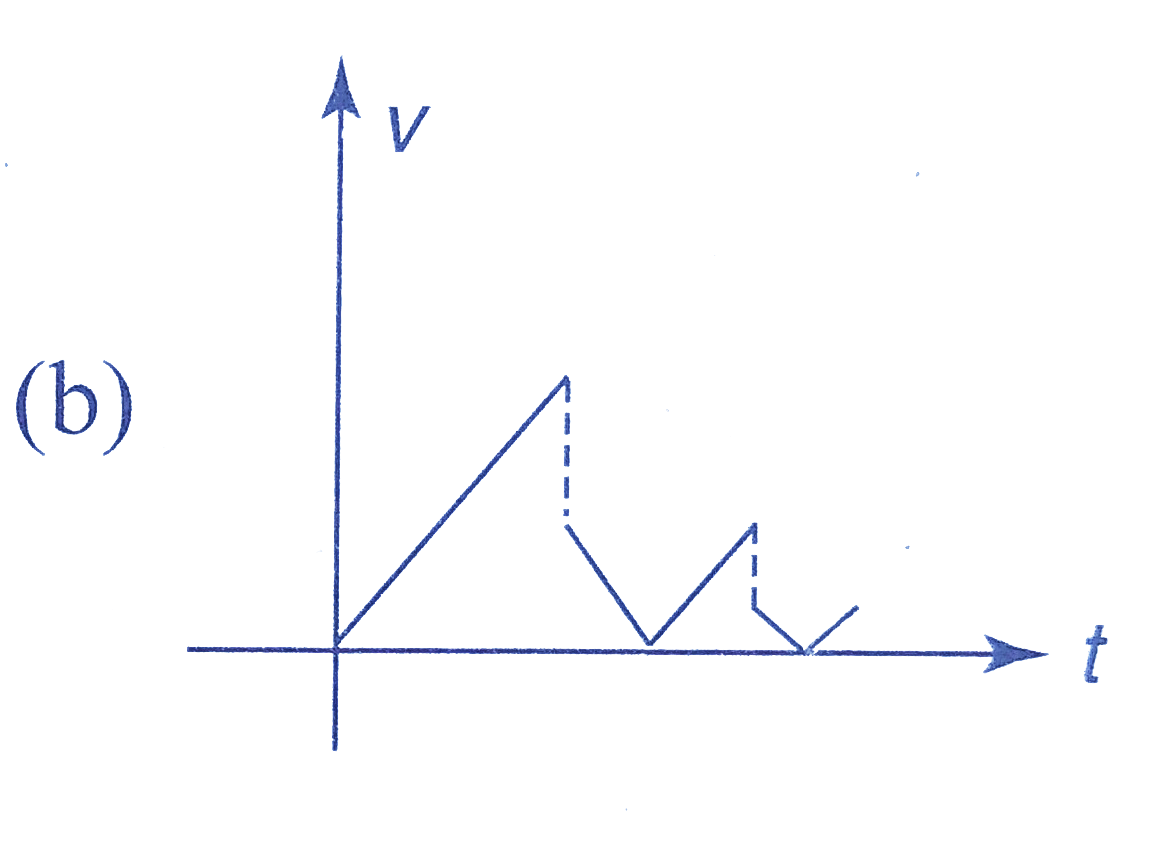 .
.C
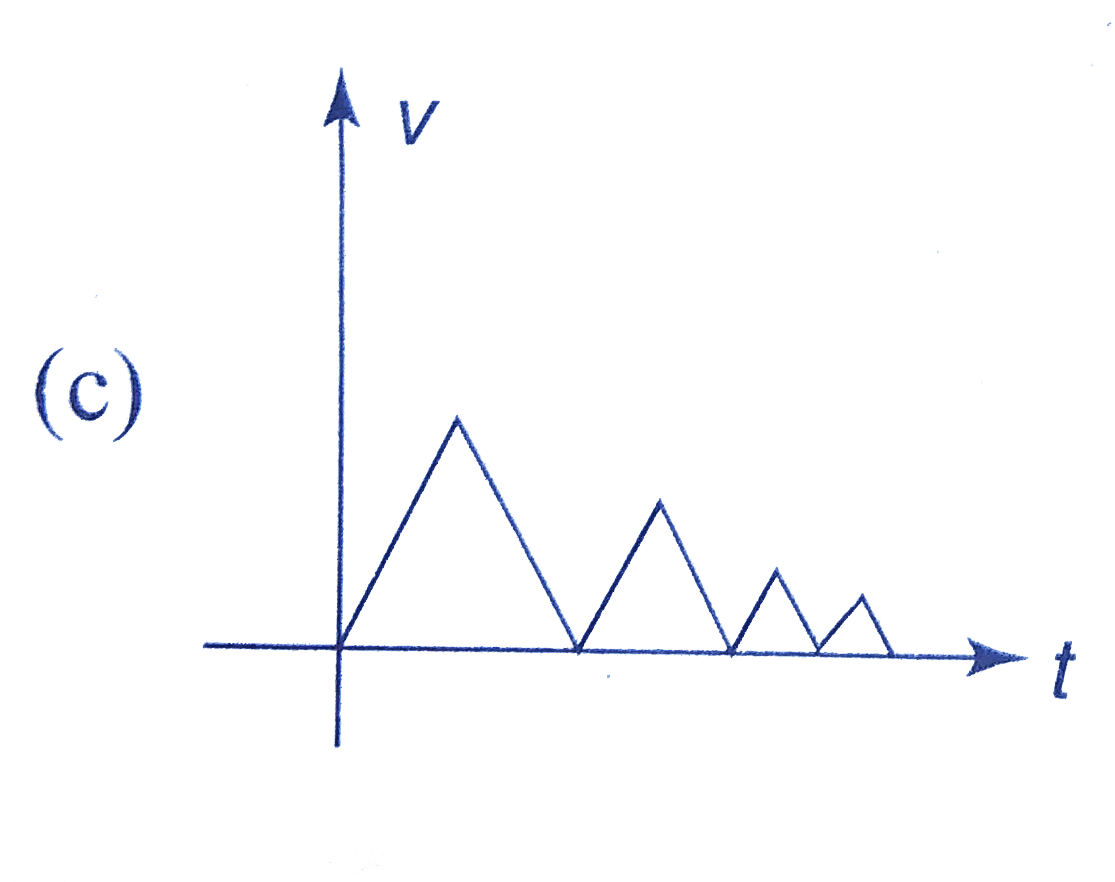 .
.D
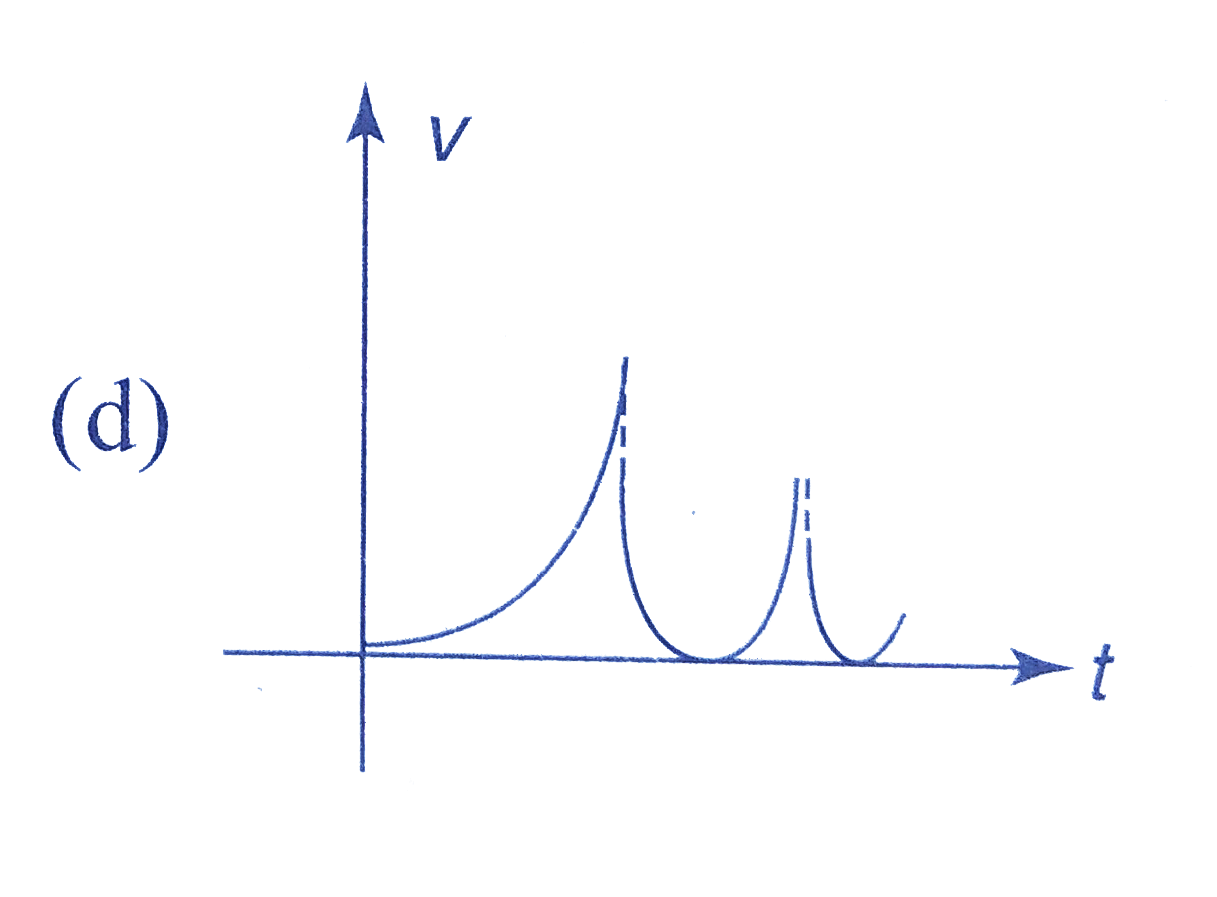 .
.Text Solution
Verified by Experts
The correct Answer is:


Topper's Solved these Questions
GENERAL KINEMATICS AND MOTION IN ONE DIMENSION
A2Z|Exercise Assertion Reasoning|20 VideosGENERAL KINEMATICS AND MOTION IN ONE DIMENSION
A2Z|Exercise NEET Questions|37 VideosGENERAL KINEMATICS AND MOTION IN ONE DIMENSION
A2Z|Exercise Understanding Motion Through Graphs|40 VideosFLUID MECHANICS
A2Z|Exercise Chapter Test|29 VideosGRAVITATION
A2Z|Exercise Chapter Test|29 Videos
Similar Questions
Explore conceptually related problems
A2Z-GENERAL KINEMATICS AND MOTION IN ONE DIMENSION-Problem Based On Mixed Concepts
- A particle is thrown upwards from ground. It experiences a constant re...
Text Solution
|
- A particle moving along a straight line with a constant acceleration o...
Text Solution
|
- A particle starts from rest with uniform acceleration and it's velocit...
Text Solution
|
- Two bikes A and B start from a point. A moves with uniform speed 40 m/...
Text Solution
|
- A parachutist after bailing out falls 50m without friction. When parac...
Text Solution
|
- Two stones are thrown up simultaneously from the edge of a cliff 240...
Text Solution
|
- The velocity of a particle is v = v0 + g t + ft^2. If its position is ...
Text Solution
|
- A body is at rest at x =0 . At t = 0, it starts moving in the posi...
Text Solution
|
- An object moving with a speed of 6.25 m//s, is deceleration at a rate ...
Text Solution
|
- Consider a rubber ball freely falling from a height h = 4.9 m onto a ...
Text Solution
|
- Two particles start moving from the same point along the same straight...
Text Solution
|
- Ball A is dropped from the top of a building. At the same instant ball...
Text Solution
|
- In a car race, car A takes t0 time less to finish than car B and passe...
Text Solution
|
- A juggler maintains four balls in motion, making each to them to rise ...
Text Solution
|
- Graph of velocity versus displacement of a particle moving in a straig...
Text Solution
|
- Velocity versus displacement graph of a particle moving in a straight ...
Text Solution
|
- A ball is dropped from a certain height on a horizontal floor. The coe...
Text Solution
|
- The speed -time graph of the ball in the above situation is.
Text Solution
|
- One stone is dropped from a tower from rest and simultaneously another...
Text Solution
|
- Two stones are thrown up simultaneously from the edge of a cliff with ...
Text Solution
|