Home
Class 11
PHYSICS
The adojoining diagram showns the veloc...

The adojoining diagram showns the velocity versus time plot for a partical . The work done by the force on the partical is positive from

A

`A` to` B`

B

`B` to `C`

C

`C` to`D`

D

`D` to` E`

Text Solution

Verified by Experts

The correct Answer is:
A

From the graph it is clear that force is acting on the partical in the region AB and due to this force kinetic energy (velocity) of the partical increases. So the work done by the force positive.
Promotional Banner

Topper's Solved these Questions

  • WORK, ENERGY, POWER AND COLLISION

    A2Z|Exercise Work-Energy Theorem|27 Videos
  • WORK, ENERGY, POWER AND COLLISION

    A2Z|Exercise Potential Energy, Conservative And Non-Conservative Forces|28 Videos
  • WAVES AND ACOUSTICS

    A2Z|Exercise Chapter Test|30 Videos

Similar Questions

Explore conceptually related problems

Calculate the work done by the gas in the state diagram shown.

Can work done by a non - conservative force be positive ?

The work done by the gas in the process shown in given P-V diagram is

Calculate the work done by the gas in the state diagram shown :

Power versus time graph for a give force is given below. Work done by the force upto time t(let_(0)).

A partical experience a force of 10 N which is constant in magnitude and is always acting towards origin. Calculate the work done by the force on the particle during its displacement from (1,2,3) to (-1,-2,3):

The graph in figure shows the velocity v versus time t for a body. Which of the graphs shown in figure represents the correesponding acceleration versus time graphs ?

A uniform force of (3 hati + hatj) newton acts on a partical of mass 2 kg . Hence the partical is displaced from position (2 hati + hatk) metre to possion (4 hati + 3 hatj - hatk) meters. The work done by the force on the partical is

A force F acting on a particle varies with the position x as shown in the graph. Find the work done by the force in displacing the particle from x =-a to x = +2a . .

The following fighures show velocity v versus time t curves. But only some of these can be realized in partice. These are

A2Z-WORK, ENERGY, POWER AND COLLISION-Chapter Test
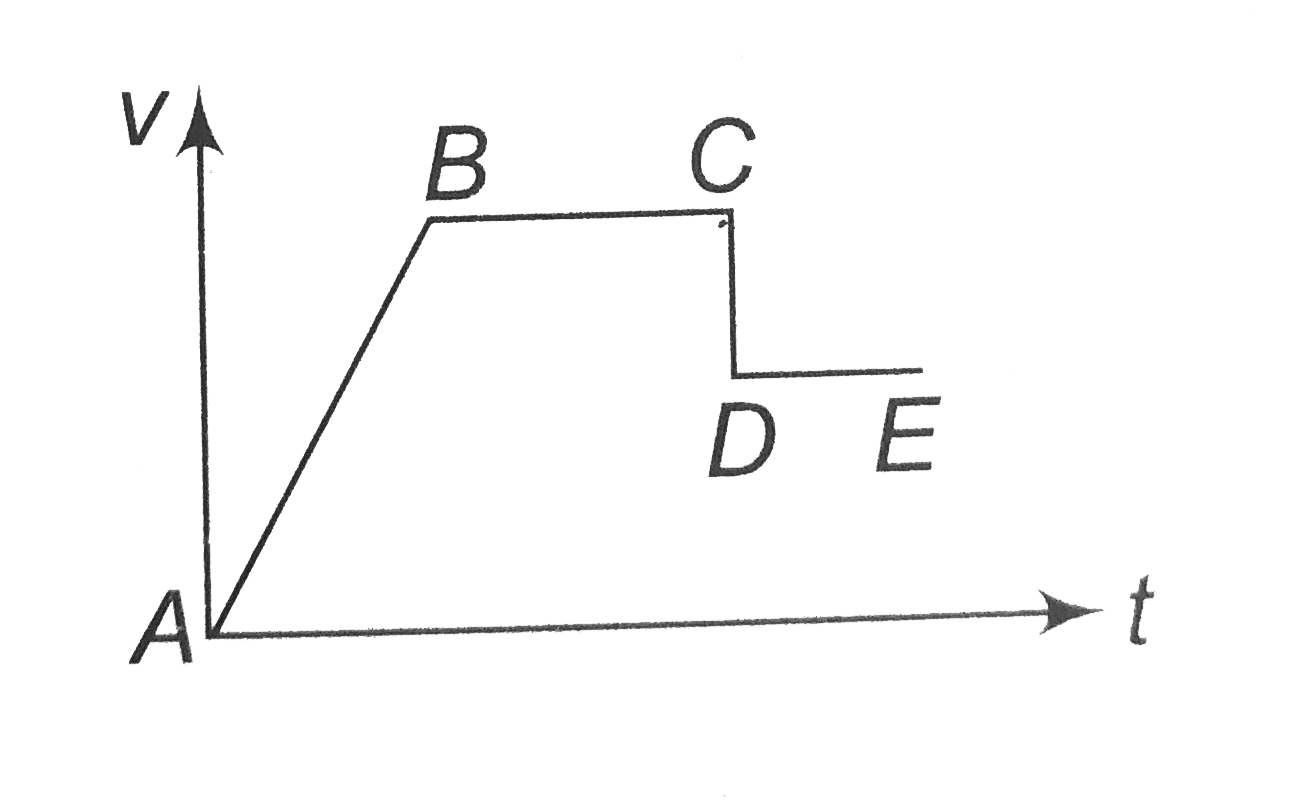
  1. The adojoining diagram showns the velocity versus time plot for a par...

    Text Solution

    |

  2. A car of mass 1000kg accelerates uniformly from rest to a velocity of ...

    Text Solution

    |

  3. A stone of mass 1 kg tied to a light inextensible string of length L =...

    Text Solution

    |

  4. A running man has half the KE that a body of half his mass has. The ma...

    Text Solution

    |

  5. A box of mass 25 kg starts from rest and slide down as inclined plane ...

    Text Solution

    |

  6. A aprtical moves on a rough horizontal ground with same initial veloci...

    Text Solution

    |

  7. The potential energy of a certain spring when stretched through a dist...

    Text Solution

    |

  8. A bullet when fixed at a target with a velocity of 100 ms^(-1), penetr...

    Text Solution

    |

  9. A bullet having a speed of 100 m//see crashes through a plank of wood....

    Text Solution

    |

  10. A mass of 50 kg is raised through a certain height by a machine whose ...

    Text Solution

    |

  11. A block is moved from rest through a distance at 4 m along a string li...

    Text Solution

    |

  12. An object of mass m is allowed to fall from rest along a rough inclin...

    Text Solution

    |

  13. Given that the position of the body in m is a function of time as foll...

    Text Solution

    |

  14. If v be the instantaneous velocity of the body dropped from the top of...

    Text Solution

    |

  15. Two springs have their force constant as k(1) and k(2) (k(1) gt k(2))...

    Text Solution

    |

  16. The power of a water pump is 2 kW. If g = 10 m//s^2, the amount of wat...

    Text Solution

    |

  17. Water is flowing in a river at 2 ms^(-1). The river is 50 m wide and h...

    Text Solution

    |

  18. The potential energy of a partical veries with distance x as shown in ...

    Text Solution

    |

  19. Which of the following graph is correct between kinetic energy E, pote...

    Text Solution

    |

  20. A ball hits a floor and rebounds after an inelastic collision. In this...

    Text Solution

    |

  21. The graph between the resistive force F acting on a body and the dista...

    Text Solution

    |