Home
Class 11
PHYSICS
The graph between the (velocity)^(2) and...

The graph between the `(velocity)^(2)` and temperature `T` of a gas is

A

B

C

D

Text Solution

AI Generated Solution

The correct Answer is:
To determine the graph between the square of the velocity \((v^2)\) and the temperature \(T\) of a gas, we can follow these steps: ### Step-by-Step Solution: 1. **Understanding the Relationship**: We start with the relationship derived from the kinetic theory of gases. The velocity \(v\) of gas molecules is related to the temperature \(T\) of the gas. According to the kinetic theory, the average velocity of gas molecules is proportional to the square root of the absolute temperature. 2. **Using the Formula**: The formula we can use is: \[ v \propto \sqrt{T} \] This means that the velocity \(v\) is directly proportional to the square root of the temperature \(T\). 3. **Squaring the Relationship**: To find the relationship between \(v^2\) and \(T\), we square both sides of the equation: \[ v^2 \propto T \] This indicates that the square of the velocity is directly proportional to the temperature. 4. **Graph Interpretation**: If we plot \(v^2\) on the y-axis and \(T\) on the x-axis, the relationship \(v^2 \propto T\) suggests that the graph will be a straight line. However, we must consider the behavior at \(T = 0\). 5. **Considering the Zero Temperature**: At absolute zero temperature (\(T = 0\)), the velocity of gas molecules does not become zero due to quantum effects. Therefore, the graph will not pass through the origin. Instead, it will start from a positive value on the y-axis. 6. **Conclusion**: Thus, the graph of \(v^2\) versus \(T\) will be a straight line that does not pass through the origin, indicating a linear relationship with a positive intercept. ### Final Answer: The graph between \((velocity)^2\) and temperature \(T\) of a gas is a straight line that does not pass through the origin. ---

To determine the graph between the square of the velocity \((v^2)\) and the temperature \(T\) of a gas, we can follow these steps: ### Step-by-Step Solution: 1. **Understanding the Relationship**: We start with the relationship derived from the kinetic theory of gases. The velocity \(v\) of gas molecules is related to the temperature \(T\) of the gas. According to the kinetic theory, the average velocity of gas molecules is proportional to the square root of the absolute temperature. 2. **Using the Formula**: ...
Promotional Banner

Topper's Solved these Questions

  • WAVES AND ACOUSTICS

    A2Z|Exercise Doppler Effect|25 Videos
  • WAVES AND ACOUSTICS

    A2Z|Exercise Problems Based On Mixed Concepts|15 Videos
  • WAVES AND ACOUSTICS

    A2Z|Exercise Vibration Of Air Column|23 Videos
  • VECTORS

    A2Z|Exercise Chapter Test|29 Videos
  • WORK, ENERGY, POWER AND COLLISION

    A2Z|Exercise Chapter Test|29 Videos

Similar Questions

Explore conceptually related problems

The graph between surface tension and temperature T is

The graph between L and T^(2) is

A particle is exdecuting a linear SHM. What is the nature of the graph between the velocity and displacement of the particle at any ins"tan"t ?

The graph between log t_(1//2) and log a at a given temperature is Rate of this reaction will …….with passage of time

The slope of the graph between log P and log V at constant temperature for a given mass of gas is

Figure shows a parabolic graph between T and (1)/(V) (T = temperature, V = Volume) for a gas undergoing an adiabatic process. If the ratio of rms velocity of molecules and speed of sound in the gas at the same temperature is sqrtn , then find the value of n.

If a piece of metal is heated to temperature theta and the allowed to cool in a room which is at temperature theta_0 , the graph between the temperature T of the metal and time t will be closet to

A2Z-WAVES AND ACOUSTICS-Sound Wave And Loudness
  1. A sound wave of frequency 440 Hz is passing through air. An O2 molecul...

    Text Solution

    |

  2. The frequency of a man's voice is 300 Hz and its wavelength is 1 meter...

    Text Solution

    |

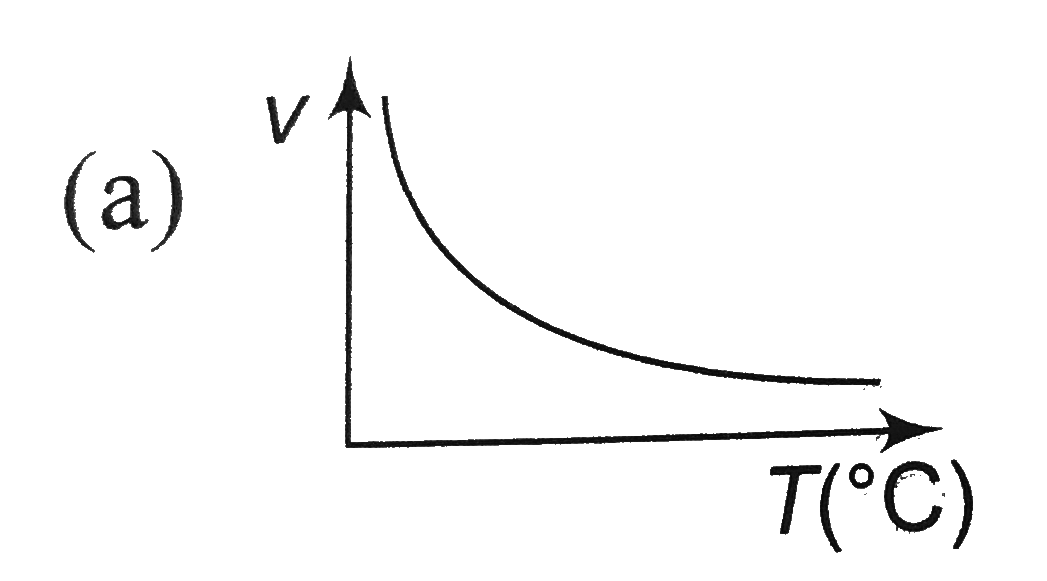
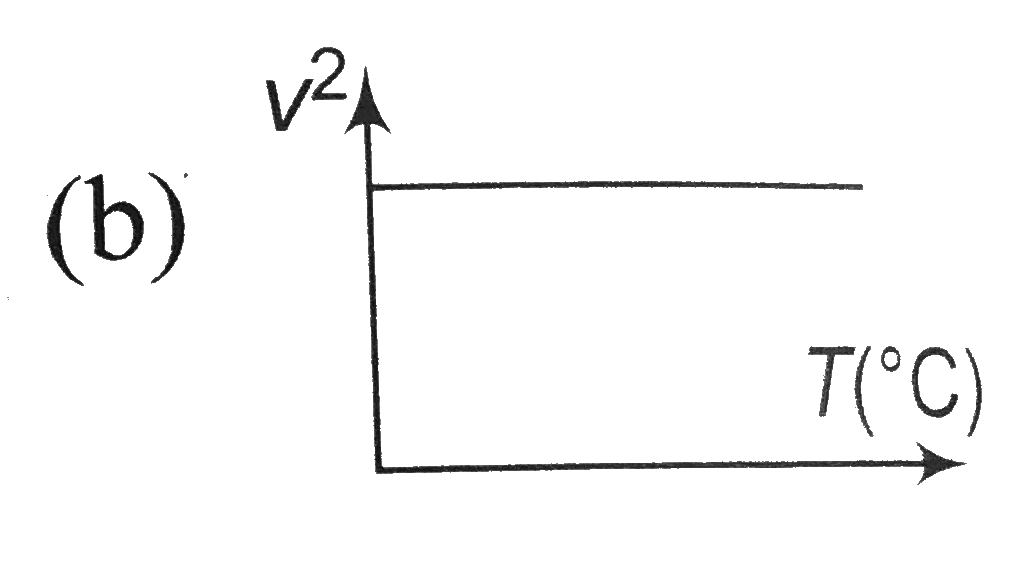
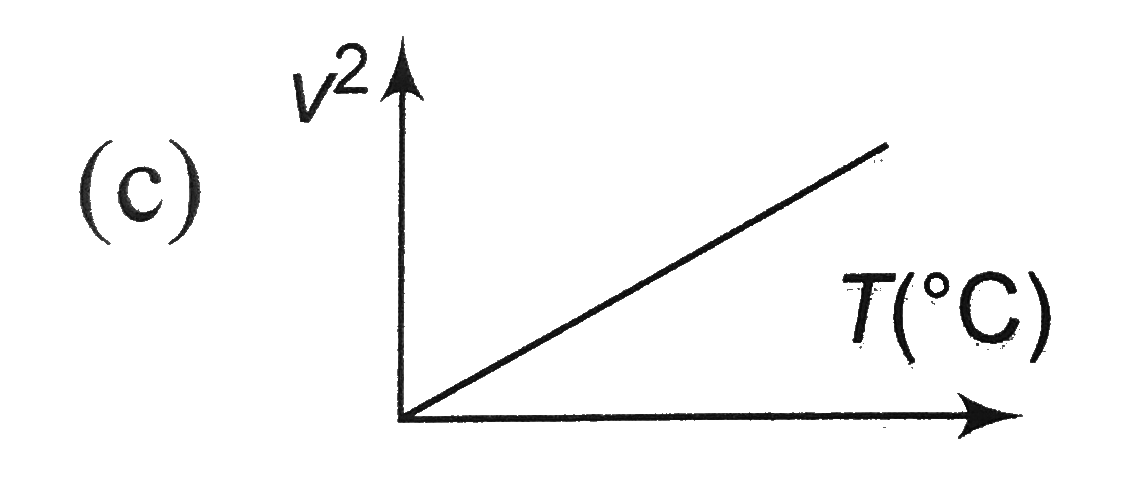
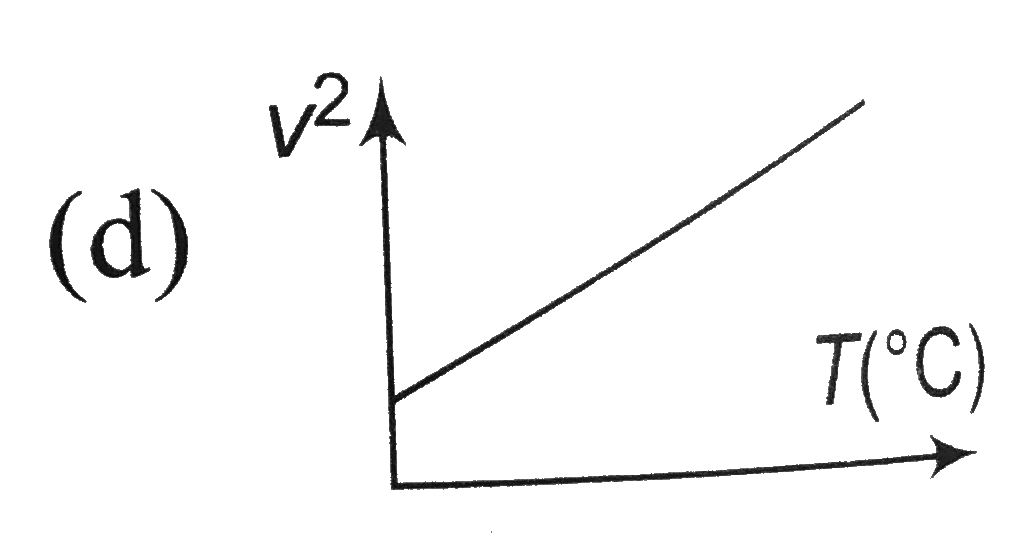
  3. The graph between the (velocity)^(2) and temperature T of a gas is

    Text Solution

    |

  4. Figure shown is a graph at a certain time t, of the displacement funct...

    Text Solution

    |

  5. The equation of displacement due to a sound wave is s = [s0sin^2(omega...

    Text Solution

    |

  6. The average density of Earth's crust 10 km beneath the surface is 2.7g...

    Text Solution

    |

  7. Two identical sound S1 and S2 reach at a point P is phase. The resulta...

    Text Solution

    |

  8. In expressing sound intensity we take 10^(-12)(W)/(m^2) as the referen...

    Text Solution

    |

  9. A two fold increase in intensity of a wave implies an increase of (Giv...

    Text Solution

    |

  10. A bir is singing on a tree and a man is hearing at a distance r from t...

    Text Solution

    |

  11. For a sound source of intensity IW//m^(2), corresponding sound level i...

    Text Solution

    |

  12. The sound intensity is 0.008W//m^( 2) at a distance of 10 m from an is...

    Text Solution

    |

  13. Source waves are emitted uniformly in all directions from a point sour...

    Text Solution

    |

  14. A point source is emitting sound in all directions. The ratio of dista...

    Text Solution

    |

  15. In a sound wave, to increase the intensity by a factor of 10, pressure...

    Text Solution

    |

  16. A person is standing at a distance D from an isotropic point source of...

    Text Solution

    |

  17. A person is talking in a small room and the sound intensity level is 6...

    Text Solution

    |

  18. A point source of power 50pi watts is producint sound waves of frequen...

    Text Solution

    |

  19. A point source of power 50pi watts is producing sound waves of frequen...

    Text Solution

    |

  20. The faintest sound the human ear can detect at a frequency of kHz (fo...

    Text Solution

    |