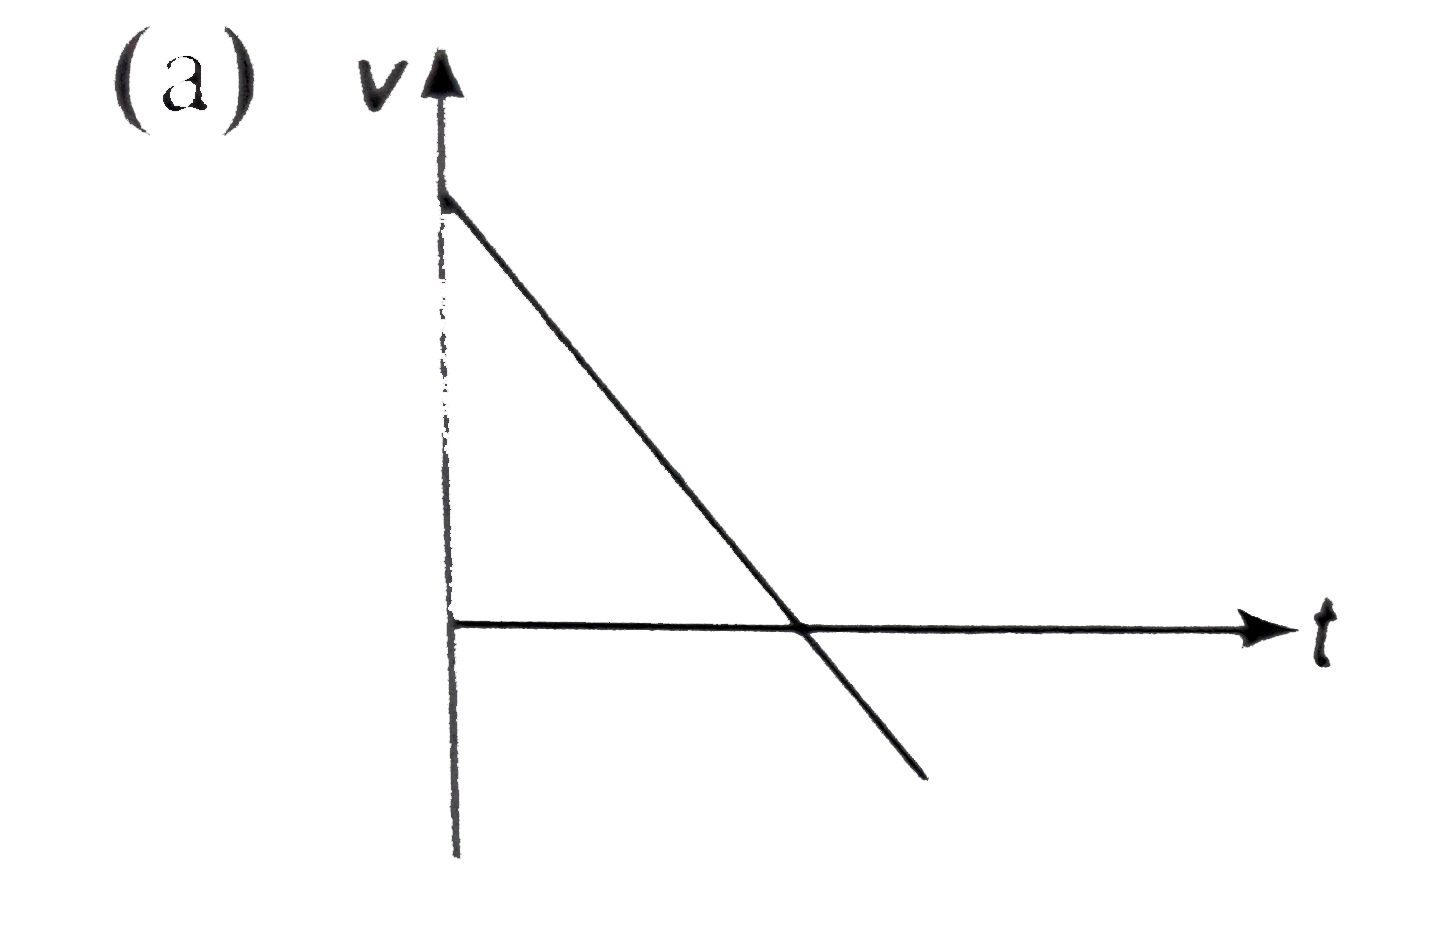
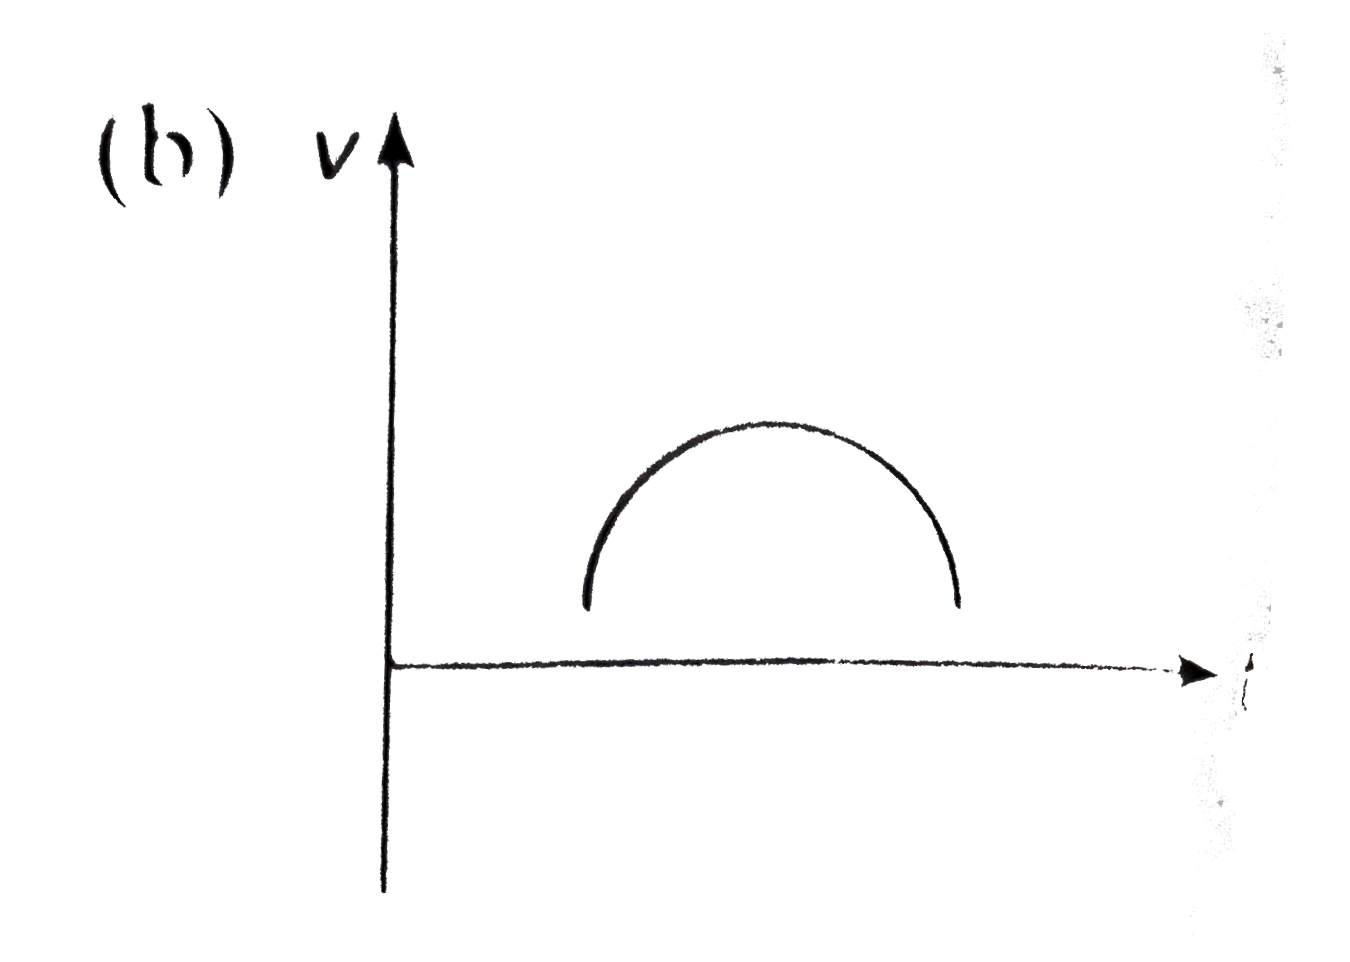
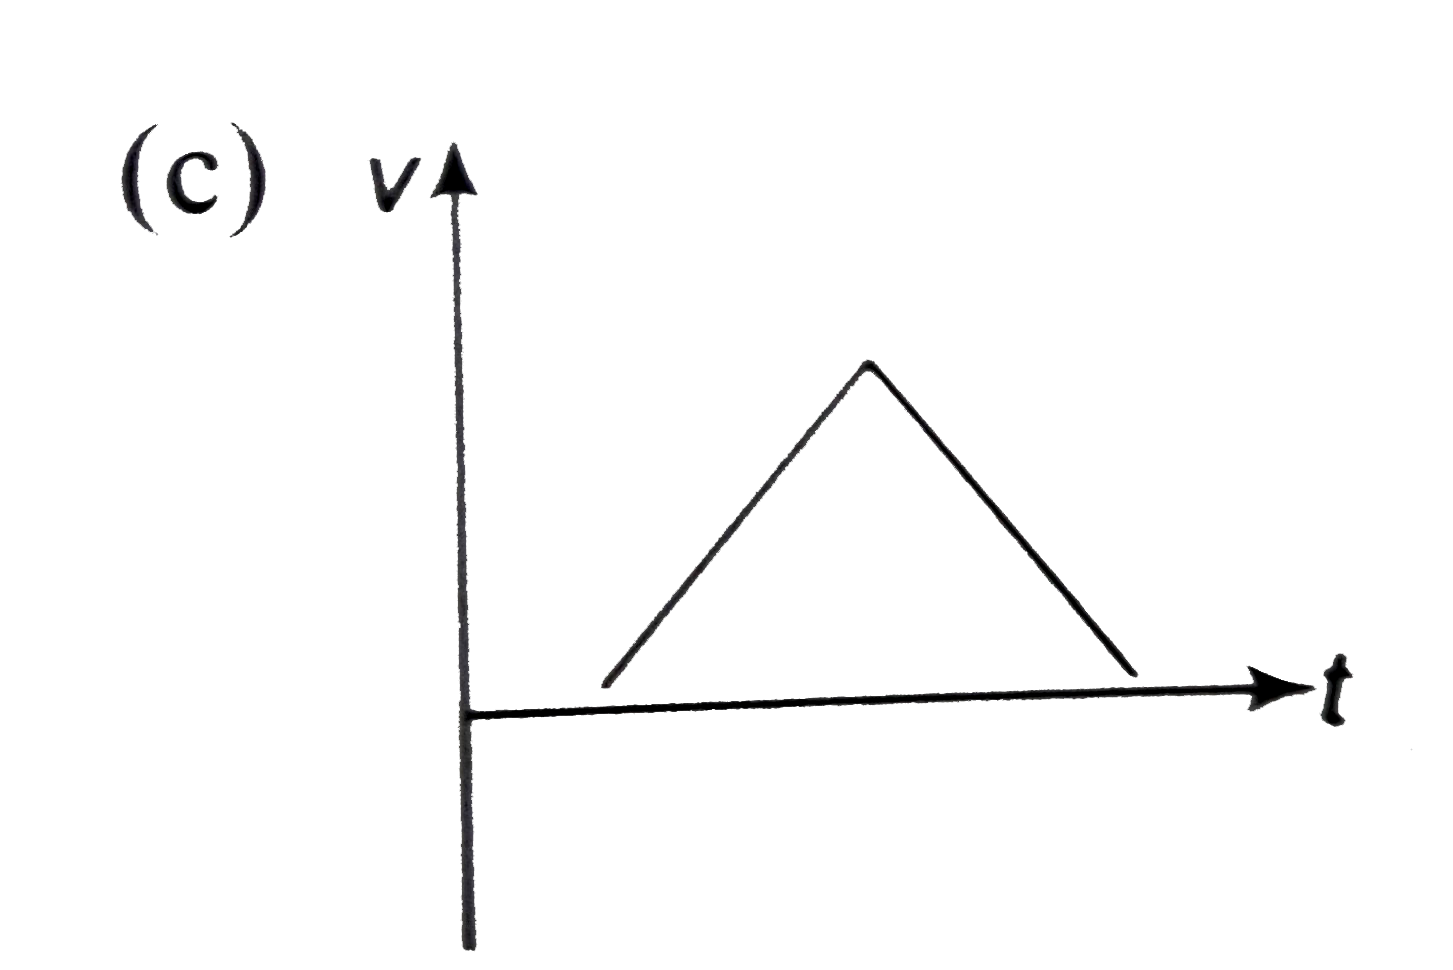
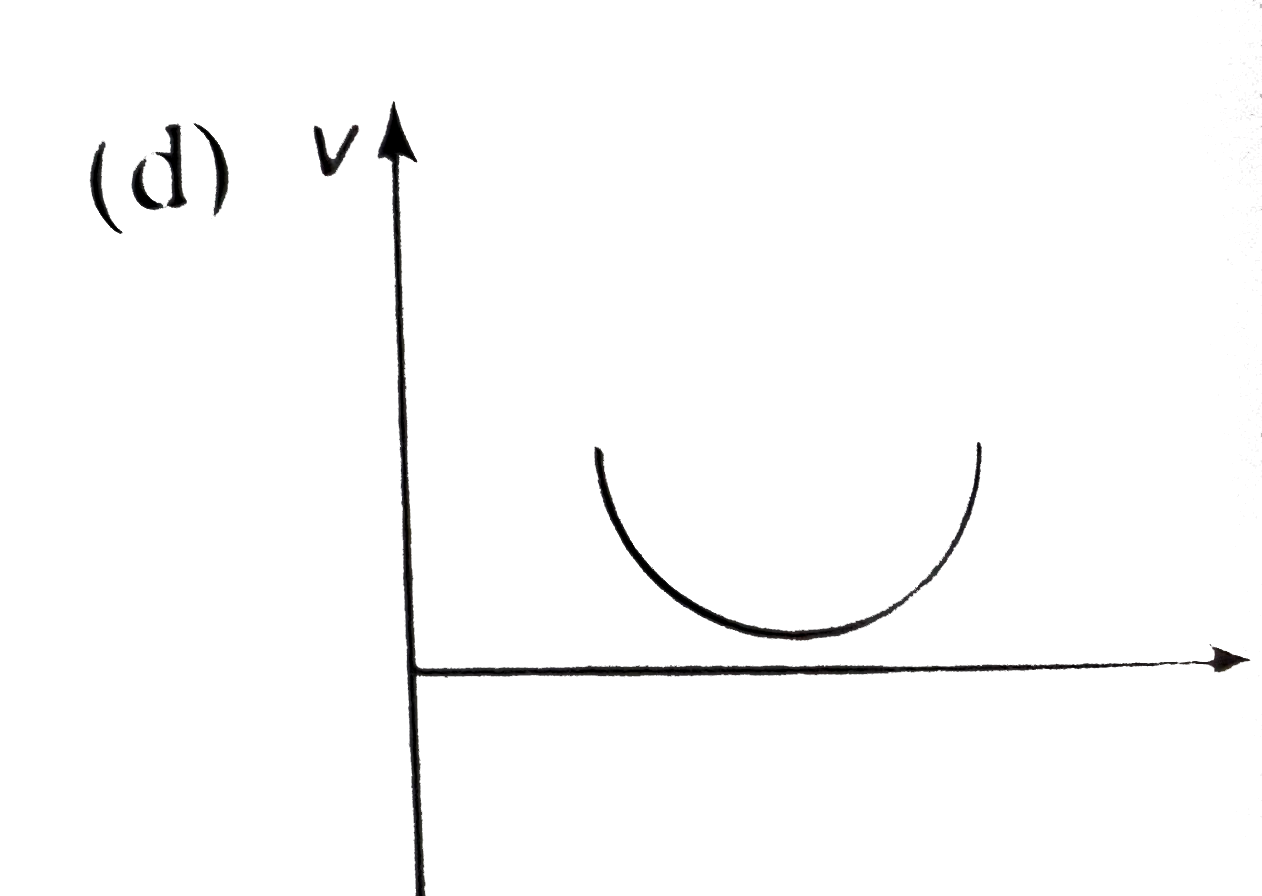
Home
Class 11
PHYSICS
A particle is thrown above, then correct...

A particle is thrown above, then correct `v-t` graph will be

A

B

C

D

Text Solution

AI Generated Solution

The correct Answer is:
To solve the problem of determining the correct velocity-time (v-t) graph for a particle thrown upwards, we can follow these steps: ### Step-by-Step Solution: 1. **Understanding the Motion**: - When a particle is thrown upwards, it initially moves against the force of gravity. As it ascends, its velocity decreases until it reaches a maximum height where the velocity becomes zero. 2. **Initial Conditions**: - Let’s denote the initial velocity of the particle as \( u \) (which is positive since it is thrown upwards). - At \( t = 0 \), the velocity \( v = u \). 3. **Velocity Decrease**: - As the particle rises, the acceleration due to gravity (\( g \)) acts downwards, causing the velocity to decrease. - The relationship between initial velocity, final velocity, acceleration, and time can be described by the equation: \[ v = u - gt \] - This equation indicates that the velocity decreases linearly with time until it reaches zero. 4. **Maximum Height**: - At the maximum height, the velocity \( v \) becomes zero. This occurs at a certain time \( t = t_{max} \), where: \[ 0 = u - gt_{max} \implies t_{max} = \frac{u}{g} \] 5. **Velocity After Maximum Height**: - After reaching the maximum height, the particle starts to fall back down. The velocity will now be negative (since it is moving in the opposite direction). - The velocity as it falls can be described by: \[ v = 0 + gt \quad (\text{for } t > t_{max}) \] - This indicates that the velocity increases in magnitude but remains negative as the particle falls back down. 6. **Graph Representation**: - The v-t graph will start at \( u \) (positive), decrease linearly to zero at \( t_{max} \), and then continue to decrease (becoming negative) as the particle falls back down, increasing in magnitude. 7. **Conclusion**: - The correct v-t graph will show a linear decrease from \( u \) to 0, followed by a linear increase in the negative direction (indicating increasing speed downwards). ### Final Answer: The correct v-t graph for a particle thrown upwards is represented by option A, which shows the described behavior.

To solve the problem of determining the correct velocity-time (v-t) graph for a particle thrown upwards, we can follow these steps: ### Step-by-Step Solution: 1. **Understanding the Motion**: - When a particle is thrown upwards, it initially moves against the force of gravity. As it ascends, its velocity decreases until it reaches a maximum height where the velocity becomes zero. 2. **Initial Conditions**: ...
Promotional Banner

Topper's Solved these Questions

  • MOCK TEST

    A2Z|Exercise General Kinematics|30 Videos
  • MOCK TEST

    A2Z|Exercise Motion With Constant Acceleration|15 Videos
  • KINETIC THEORY OF GASES AND THERMODYNAMICS

    A2Z|Exercise Chapter Test|29 Videos
  • MOTION IN TWO DIMENSION

    A2Z|Exercise Chapter Test|29 Videos

Similar Questions

Explore conceptually related problems

A particleis thrown above, the correct v-t graph will be

Choose the correct a vs t graph

A particle is thrown vertically upwards. The correct graph between its speed (v) and time (t) is given by (neglecting air resistance)

The acceleration versus time graph of a particle is shown in the figure. The respective v-t graph of the particle is . .

A particle is moving in a straight line according to graph given below : (a is acceleration, v is velocity, x is position, t is time) :

From given v-t graph identify correct a-t graph

A particle moves along x- axis. It's velocity is a function of time according to relation V=(3t^(2)-18t+24)m//s assume at t=0 particle is at origin. Which of the following graph may be correct for the motion of particle

A particle obeys the following v - t graph as shown. The average velocity over 30 s is

A particle is moving along the x-axis. Consider it’s a-t graph. If initial velocity is 10 m//s, sketch the v-t graph and calculate the displacement in the time interval t=0 to 12 s.