Text Solution
Verified by Experts


Topper's Solved these Questions
Similar Questions
Explore conceptually related problems
PRADEEP-MOTION-Short answer questions
- A particle moves in a circle of radius R. In half the period of revo...
Text Solution
|
- What is locomotion ?
Text Solution
|
- What are the values of distance travelled and displacement in covering...
Text Solution
|
- Convert a speed of 36 km//h into m//s.
Text Solution
|
- Convert a speed of 15 m//s into km//h.
Text Solution
|
- Name the terms represented by various symbols in the eqaution, v = u +...
Text Solution
|
- What can you say about the motion of a body if (a) its displacement-...
Text Solution
|
- What conclusion do you draw when displacement-time graph of a body is ...
Text Solution
|
- What conclusion do you draw when displacement-time graph of a body is ...
Text Solution
|
- If velocity-time graph of a body is as shown in figure, what is the na...
Text Solution
|
- What can you calculate from speed-time graph of a body ?
Text Solution
|
- Name the two quantities, the slope of whose graphs gives (i) speed (ii...
Text Solution
|
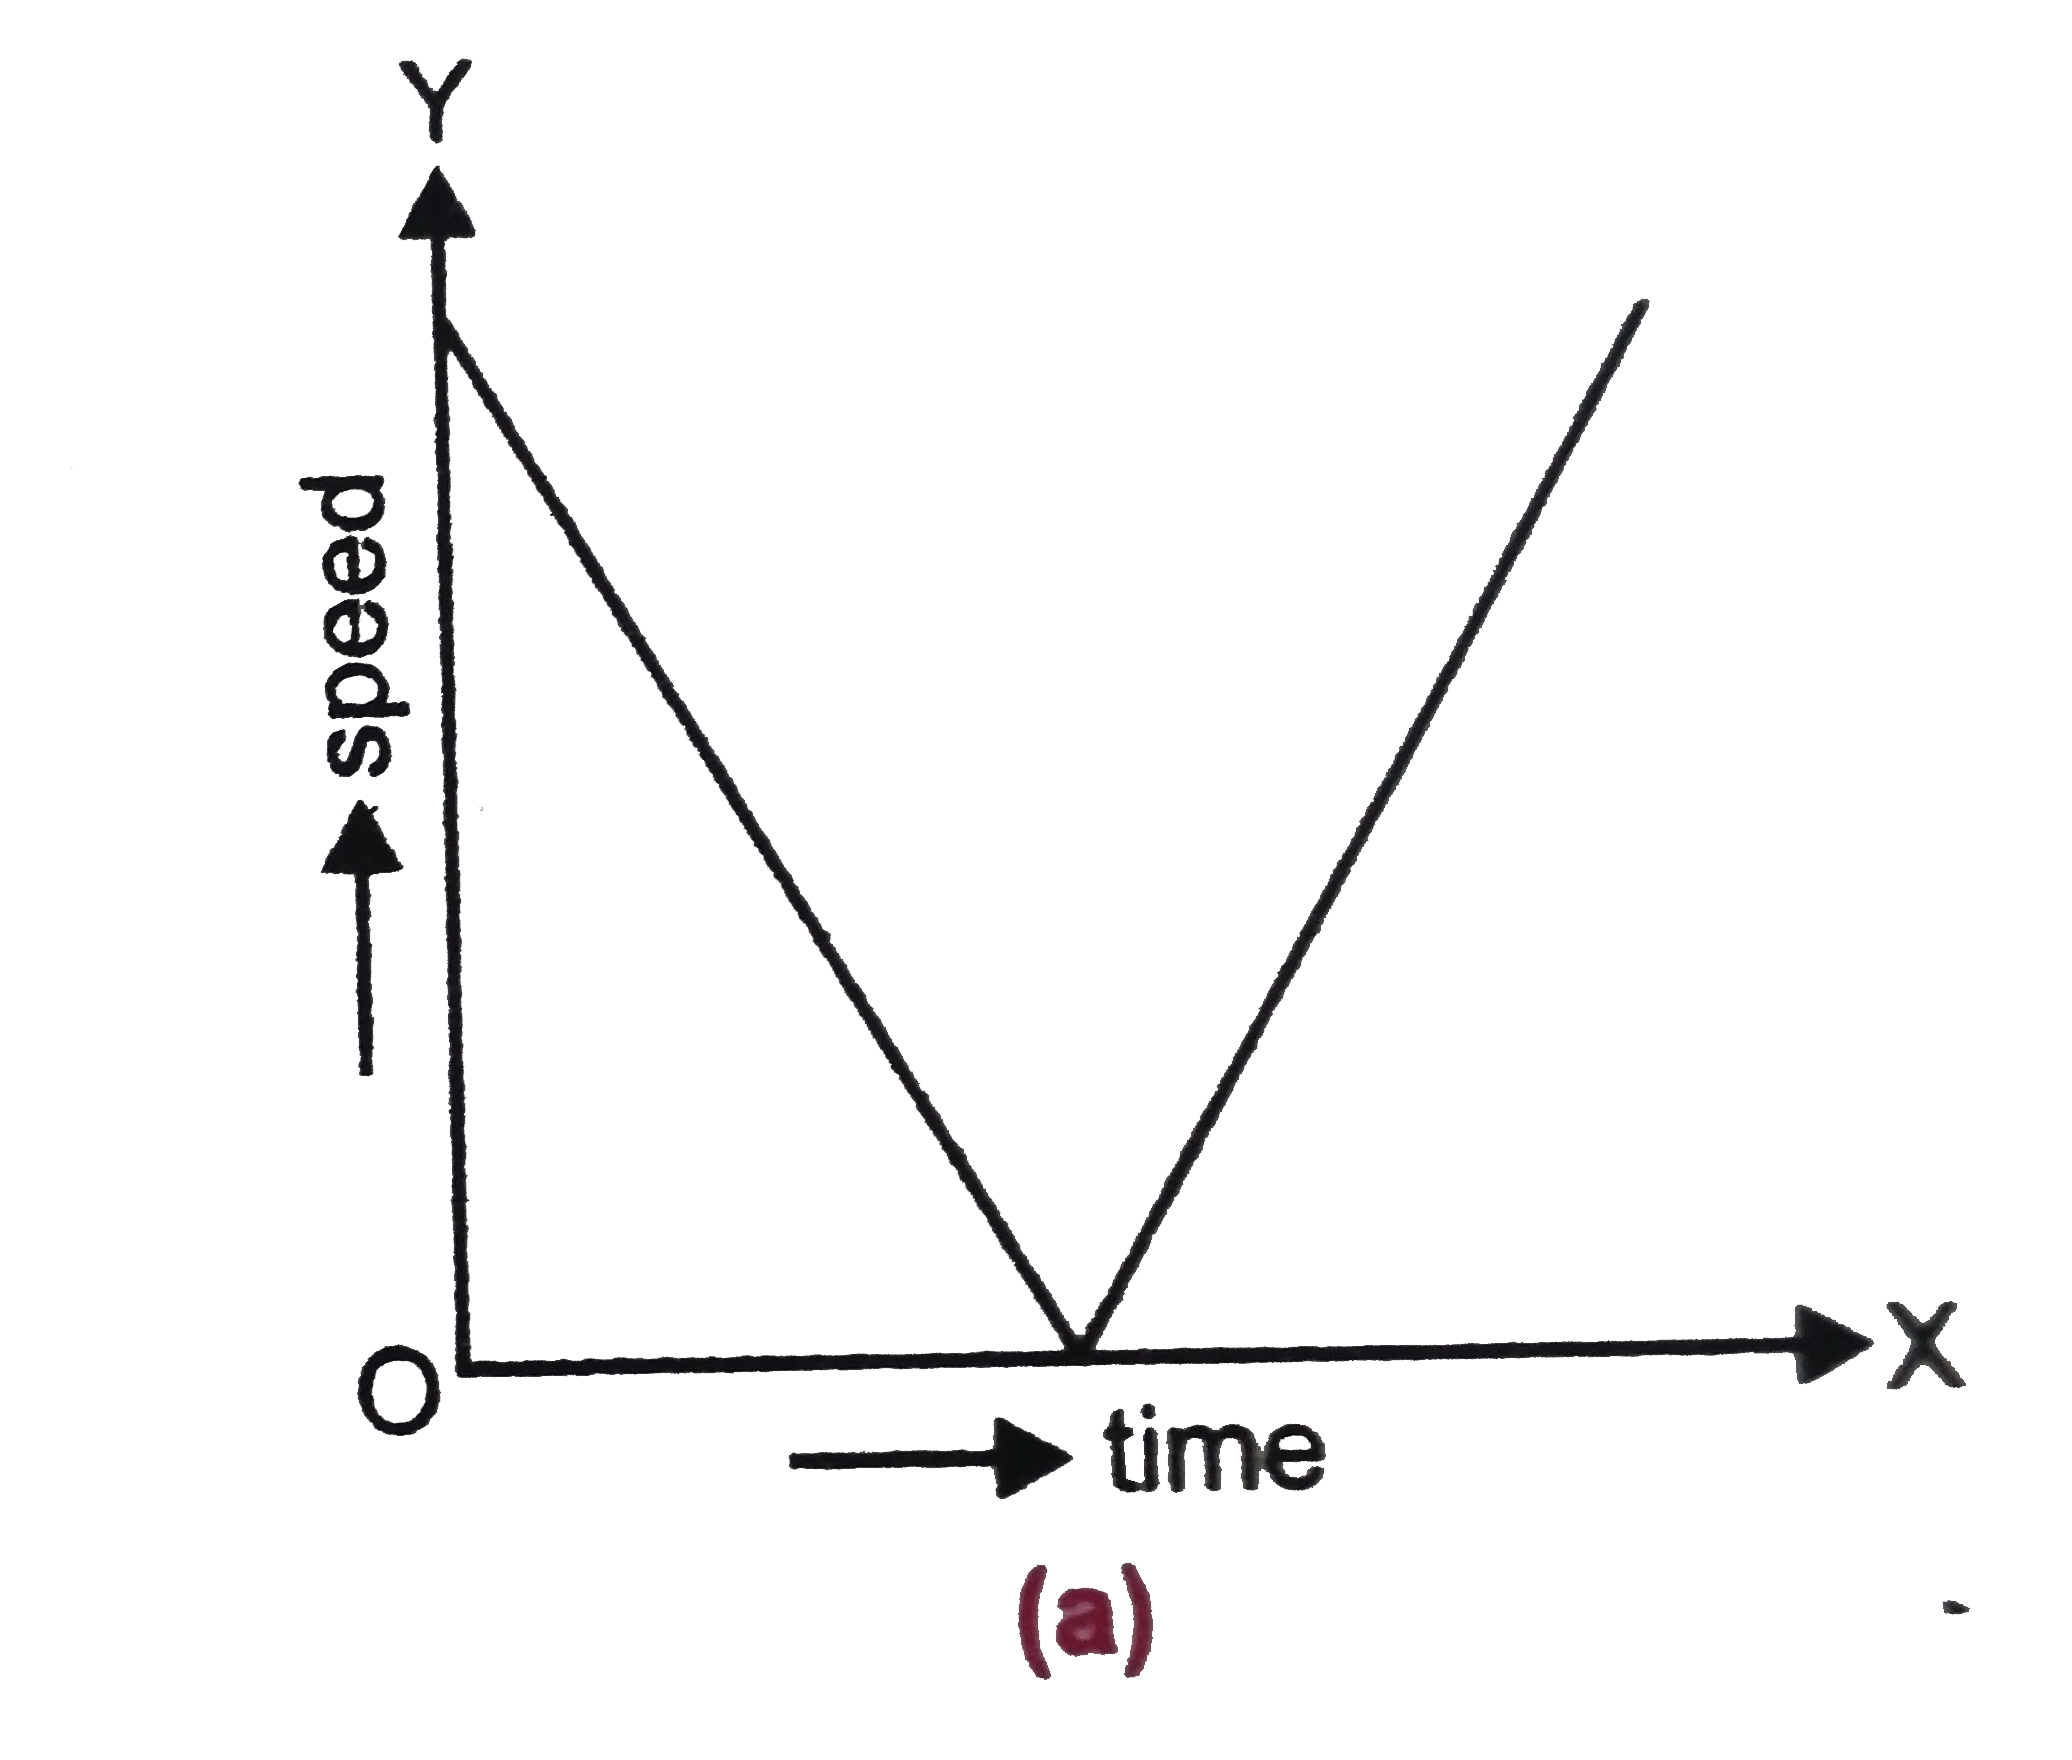
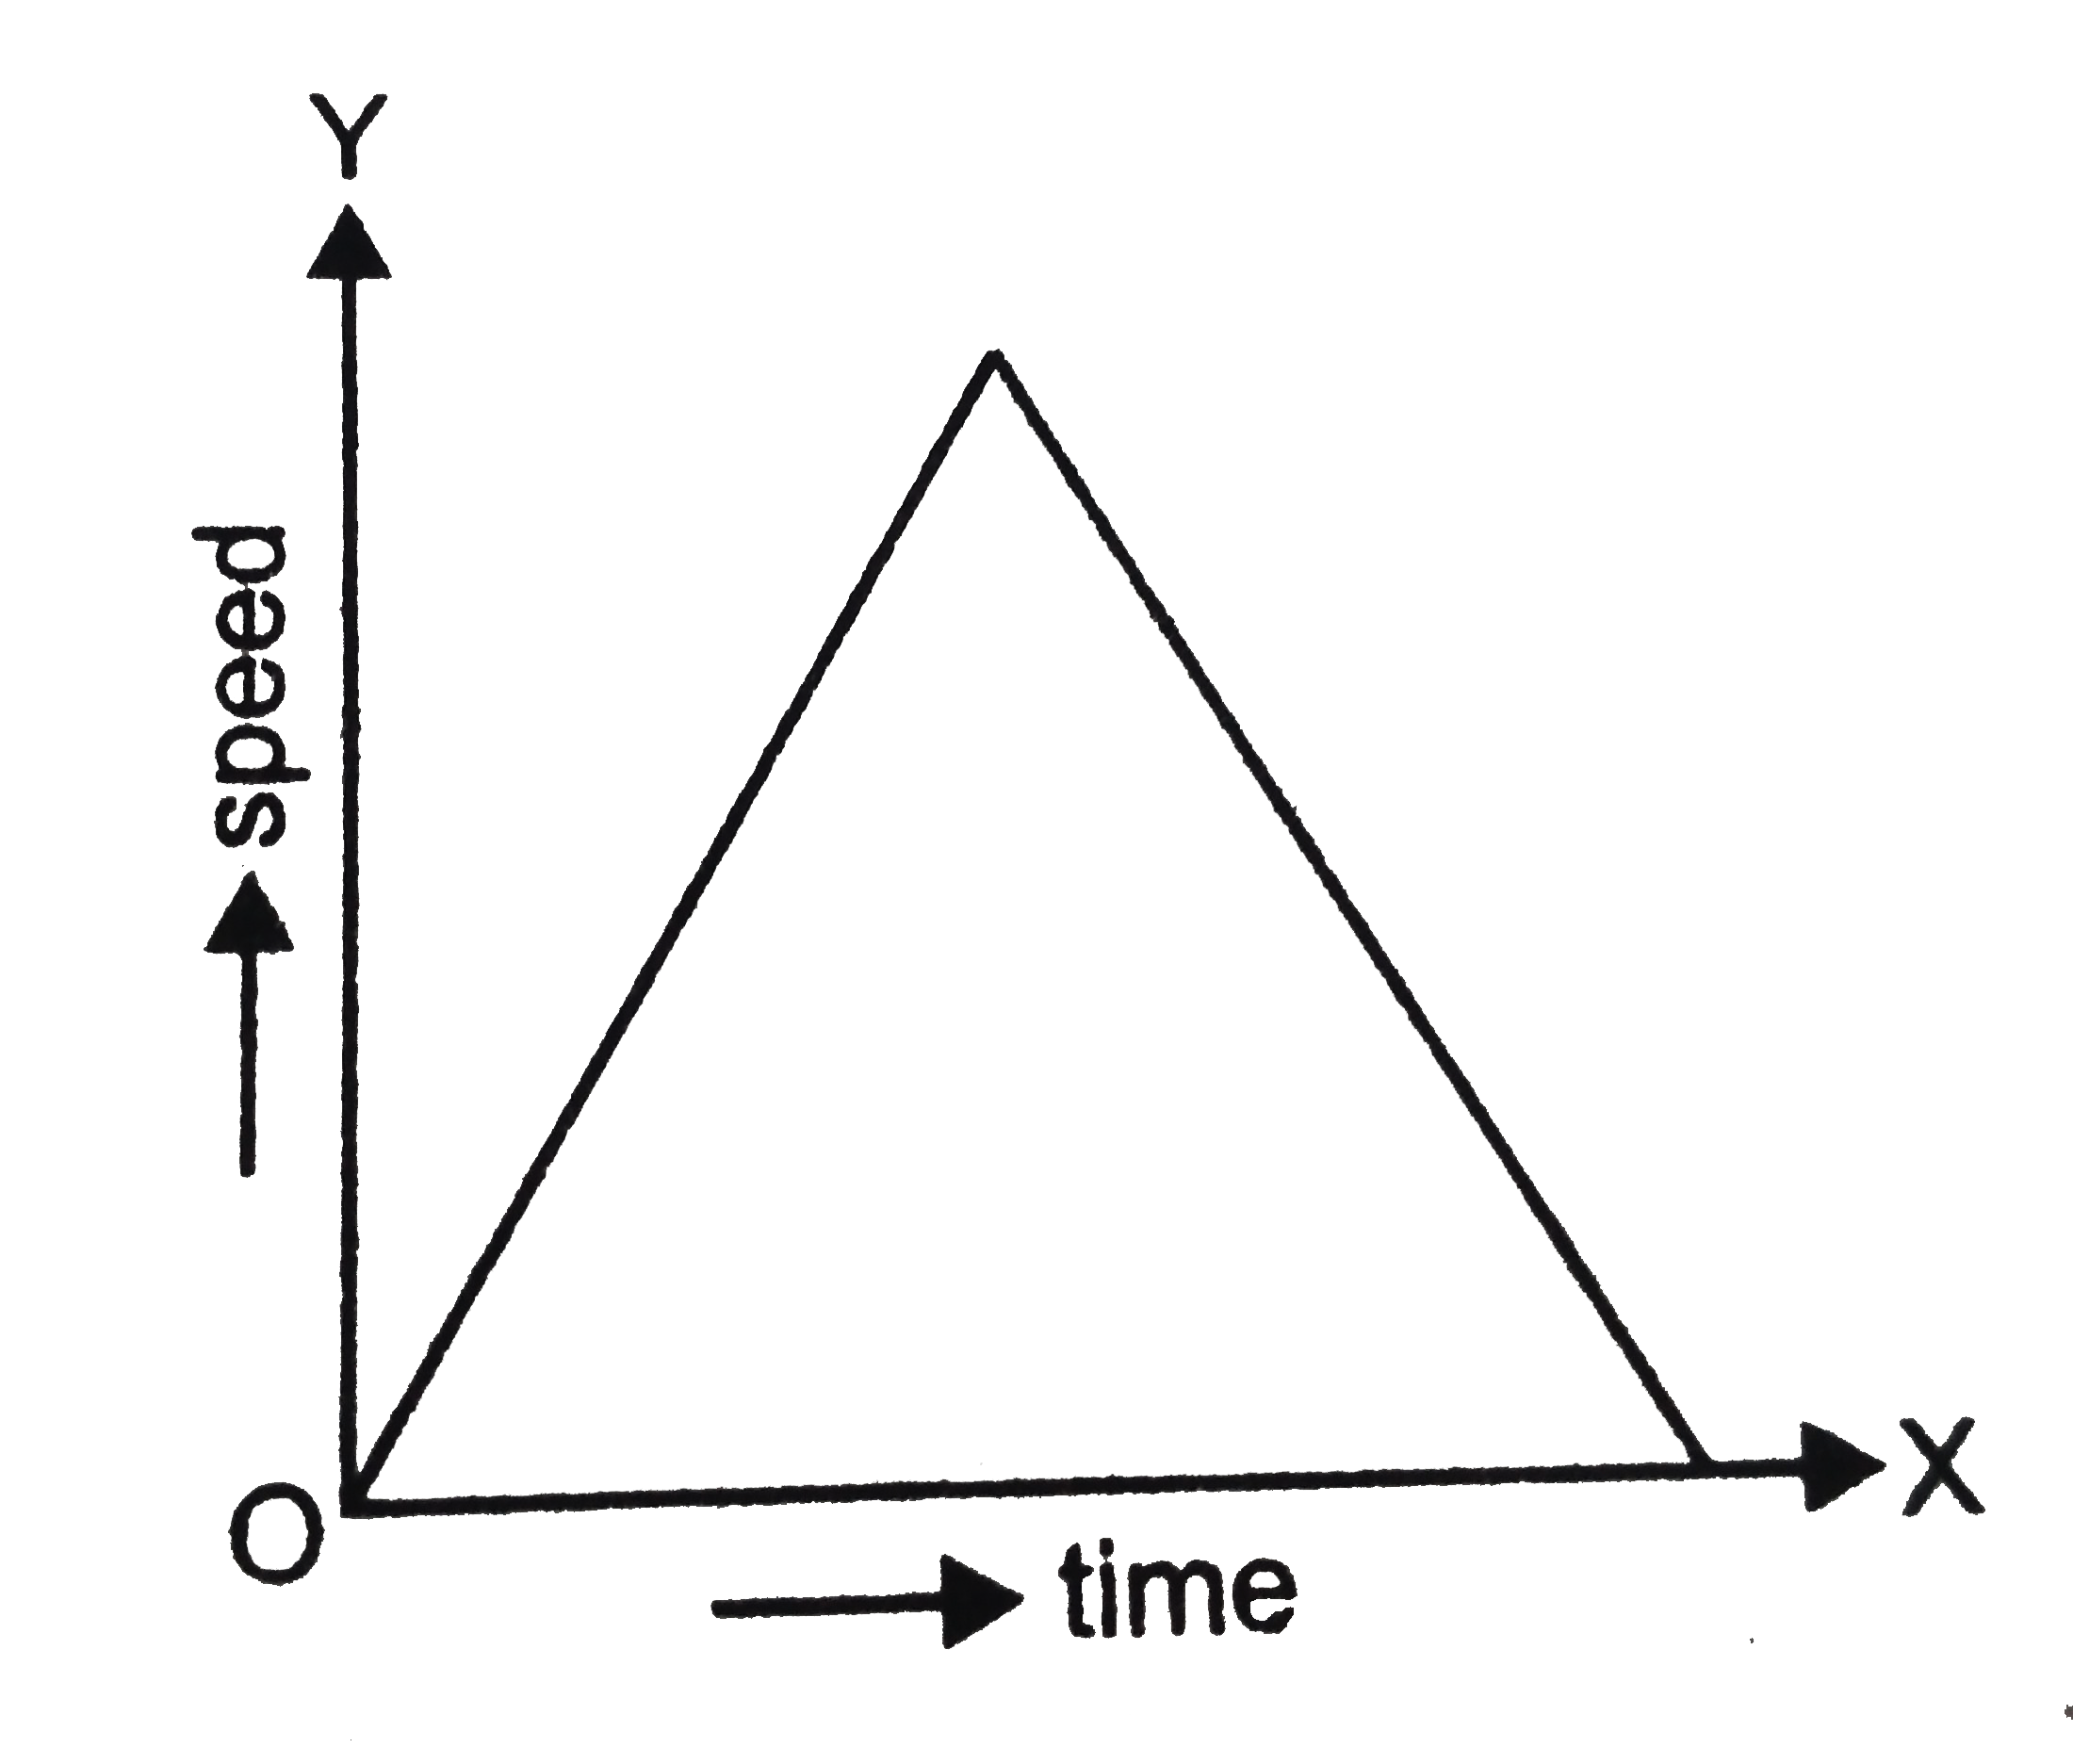
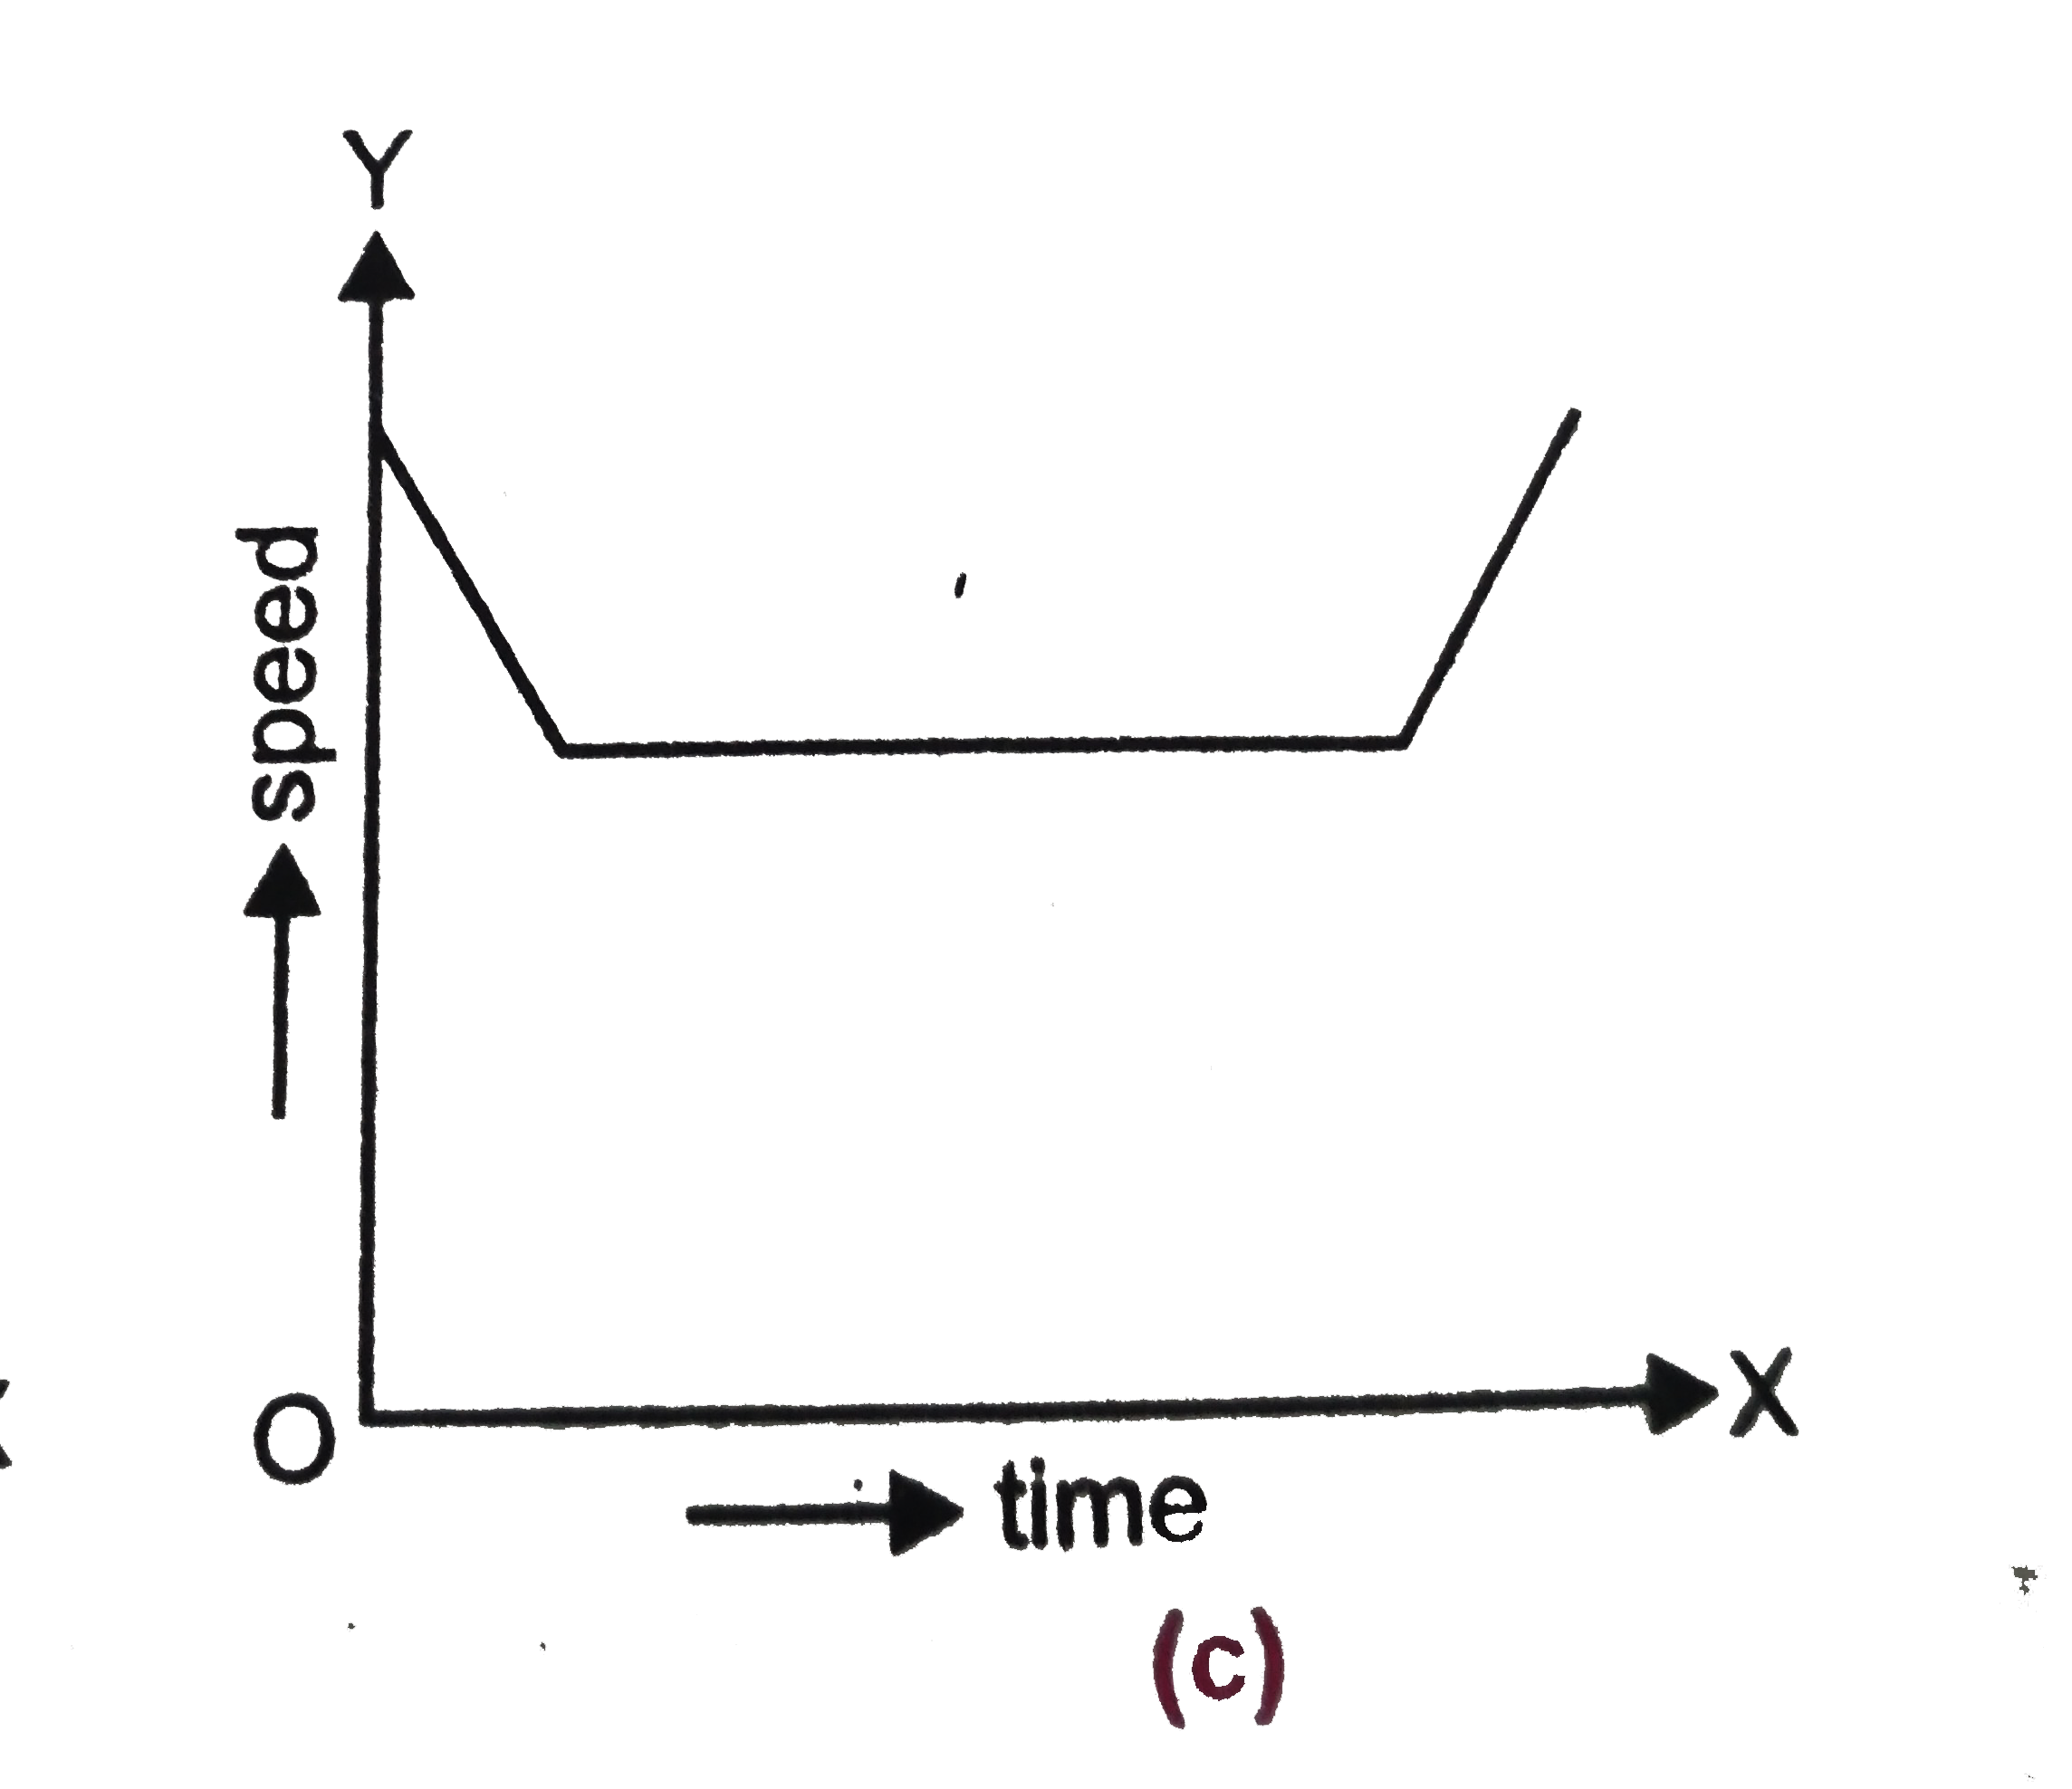
- Three speed-time graphs are shown below. (i) A ball thrown ...
Text Solution
|
- What do the graph shown in Figure indicate ?
Text Solution
|
- What is represented by the graph in Figure ?
Text Solution
|