Text Solution
Verified by Experts


Topper's Solved these Questions
Similar Questions
Explore conceptually related problems
PRADEEP-MOTION-Quiz testing
- (a) Can distance travelled by an object in motion be negative? (b) C...
Text Solution
|
- (a) Between two given positions , which is fixed : distance or displac...
Text Solution
|
- (a) An object completes one and a half revolution in a circle of radiu...
Text Solution
|
- (a) Out of speed and velocity , which one is scalar and which one is v...
Text Solution
|
- (a) Which of the following is not a unit of velocity ms^(-1) , cm s^(...
Text Solution
|
- (a) A car travels first 30 km at a uniform speed of 20 km//h and next...
Text Solution
|
- (a) The distance time graph of a body is parallel to the time axis. Wh...
Text Solution
|
- (a) A body starting from rest moves with a constant acceleration of 5 ...
Text Solution
|
- (a) The distance time graph of bodies A and B are shown in Figure. Whi...
Text Solution
|
- (a) The distance time graph of a body makes an angle of 30^(@) with ti...
Text Solution
|
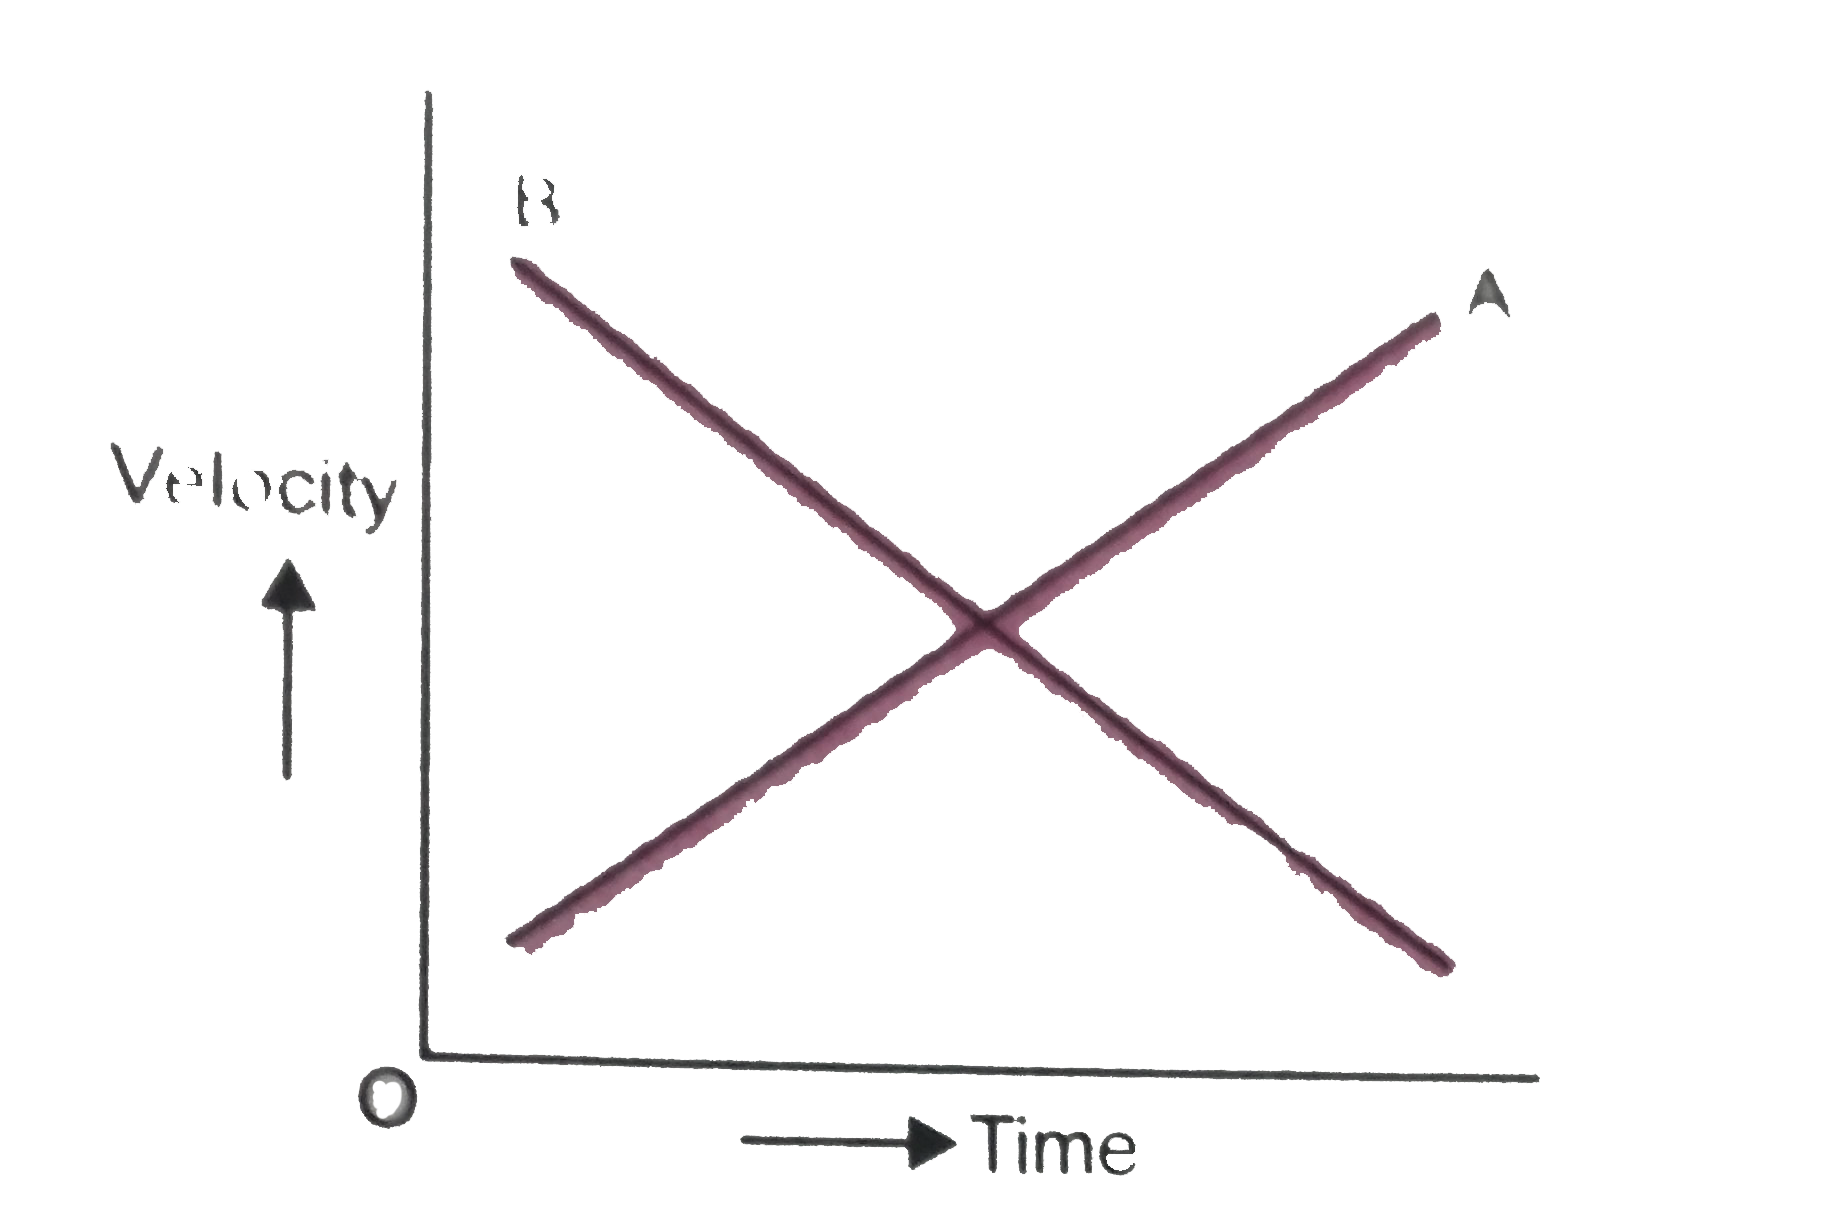
- (a) Look at the velocity time graph of two bodies A and B, Figure. whi...
Text Solution
|
- (a) The velocity time graph of two bodies are shown in Figure. Slope o...
Text Solution
|