Text Solution
Verified by Experts


Topper's Solved these Questions
MOTION
PRADEEP|Exercise formative Assesment paper pen test|15 VideosMOTION
PRADEEP|Exercise Formative Assessment 1(b) - Oral testing (Exercise)|1 VideosMOTION
PRADEEP|Exercise Worksheet testing(fill in the blanks)|5 VideosGRAVITATION
PRADEEP|Exercise Model Test paper (1)|36 VideosSOUND
PRADEEP|Exercise Model Test (sec - B)|12 Videos
Similar Questions
Explore conceptually related problems
PRADEEP-MOTION-Worksheet testing
- A bus decreases its speed from 72 km//h to 54 km//h in 10 s. Calculat...
Text Solution
|
- A train is travelling at a speed of 108 km//h. How much distance is it...
Text Solution
|
- The average speed of a person in driving to school is 30 km//h. On the...
Text Solution
|
- Alka jogs from one end A to the other end B of a srtaight 250 m road i...
Text Solution
|
- A train starting from rest moves with a uniform acceleration of 0.2 m/...
Text Solution
|
- A train running at 108 km//h is brought to a halt in 2 minutes. Calcul...
Text Solution
|
- A ball thrown vertically upwards returns to the thrower in 20 second. ...
Text Solution
|
- Calculate the speed of tip of minutes hand of a clock, whose length is...
Text Solution
|
- A stone of mass 50 g is being rotated in a circle of radius 50 cm with...
Text Solution
|
- The ditance time graph of two bodies A and B are shown in Figure. Obse...
Text Solution
|
- The velocity time graphs of two bodies A and B are shown in Figure. Ob...
Text Solution
|
- Draw velocity time graph of a body which is moving with some initial v...
Text Solution
|
- Draw distance time graph of a body moving with constant acceleration.
Text Solution
|
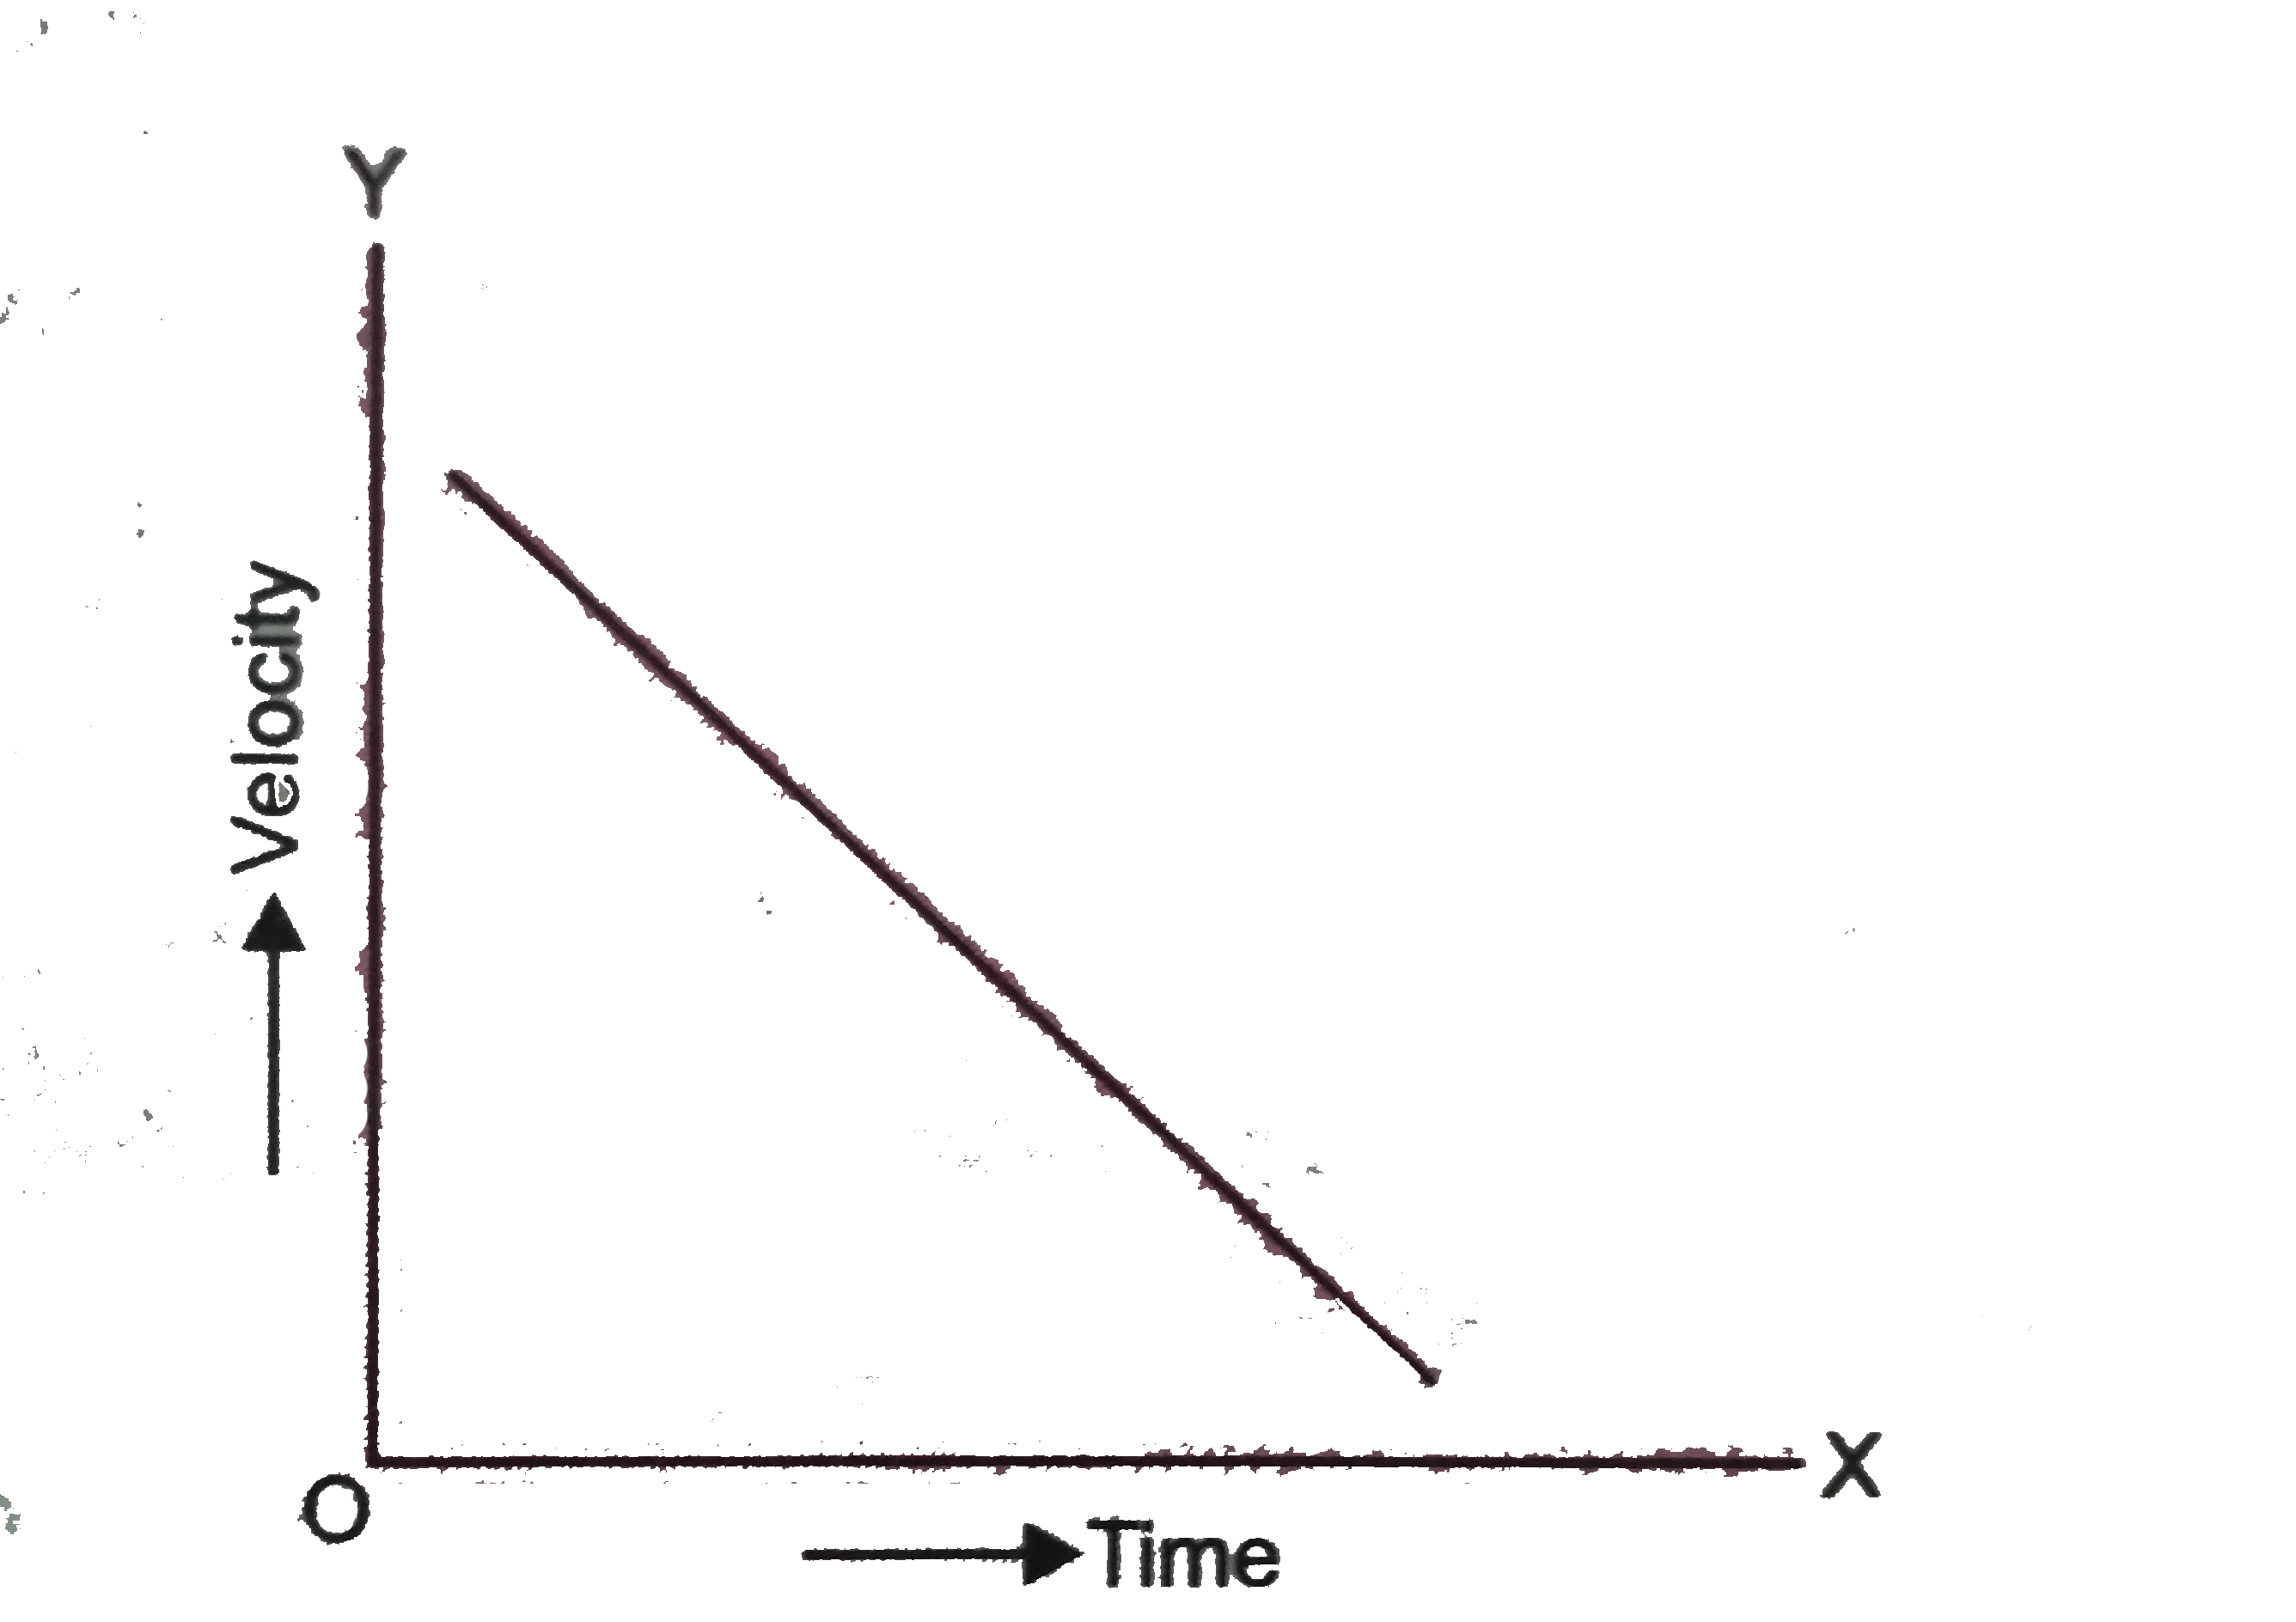
- Draw velocity time graph of a body moving with constant retardation.
Text Solution
|
- A body A is at rest and body B is moving with a constant velocity. D...
Text Solution
|
- A driver of a car A travelling at 54 km//h applies the brakes and stop...
Text Solution
|