Text Solution
Verified by Experts


Topper's Solved these Questions
Similar Questions
Explore conceptually related problems
PRADEEP-KINEMATICS-1 NCERT Comprehension
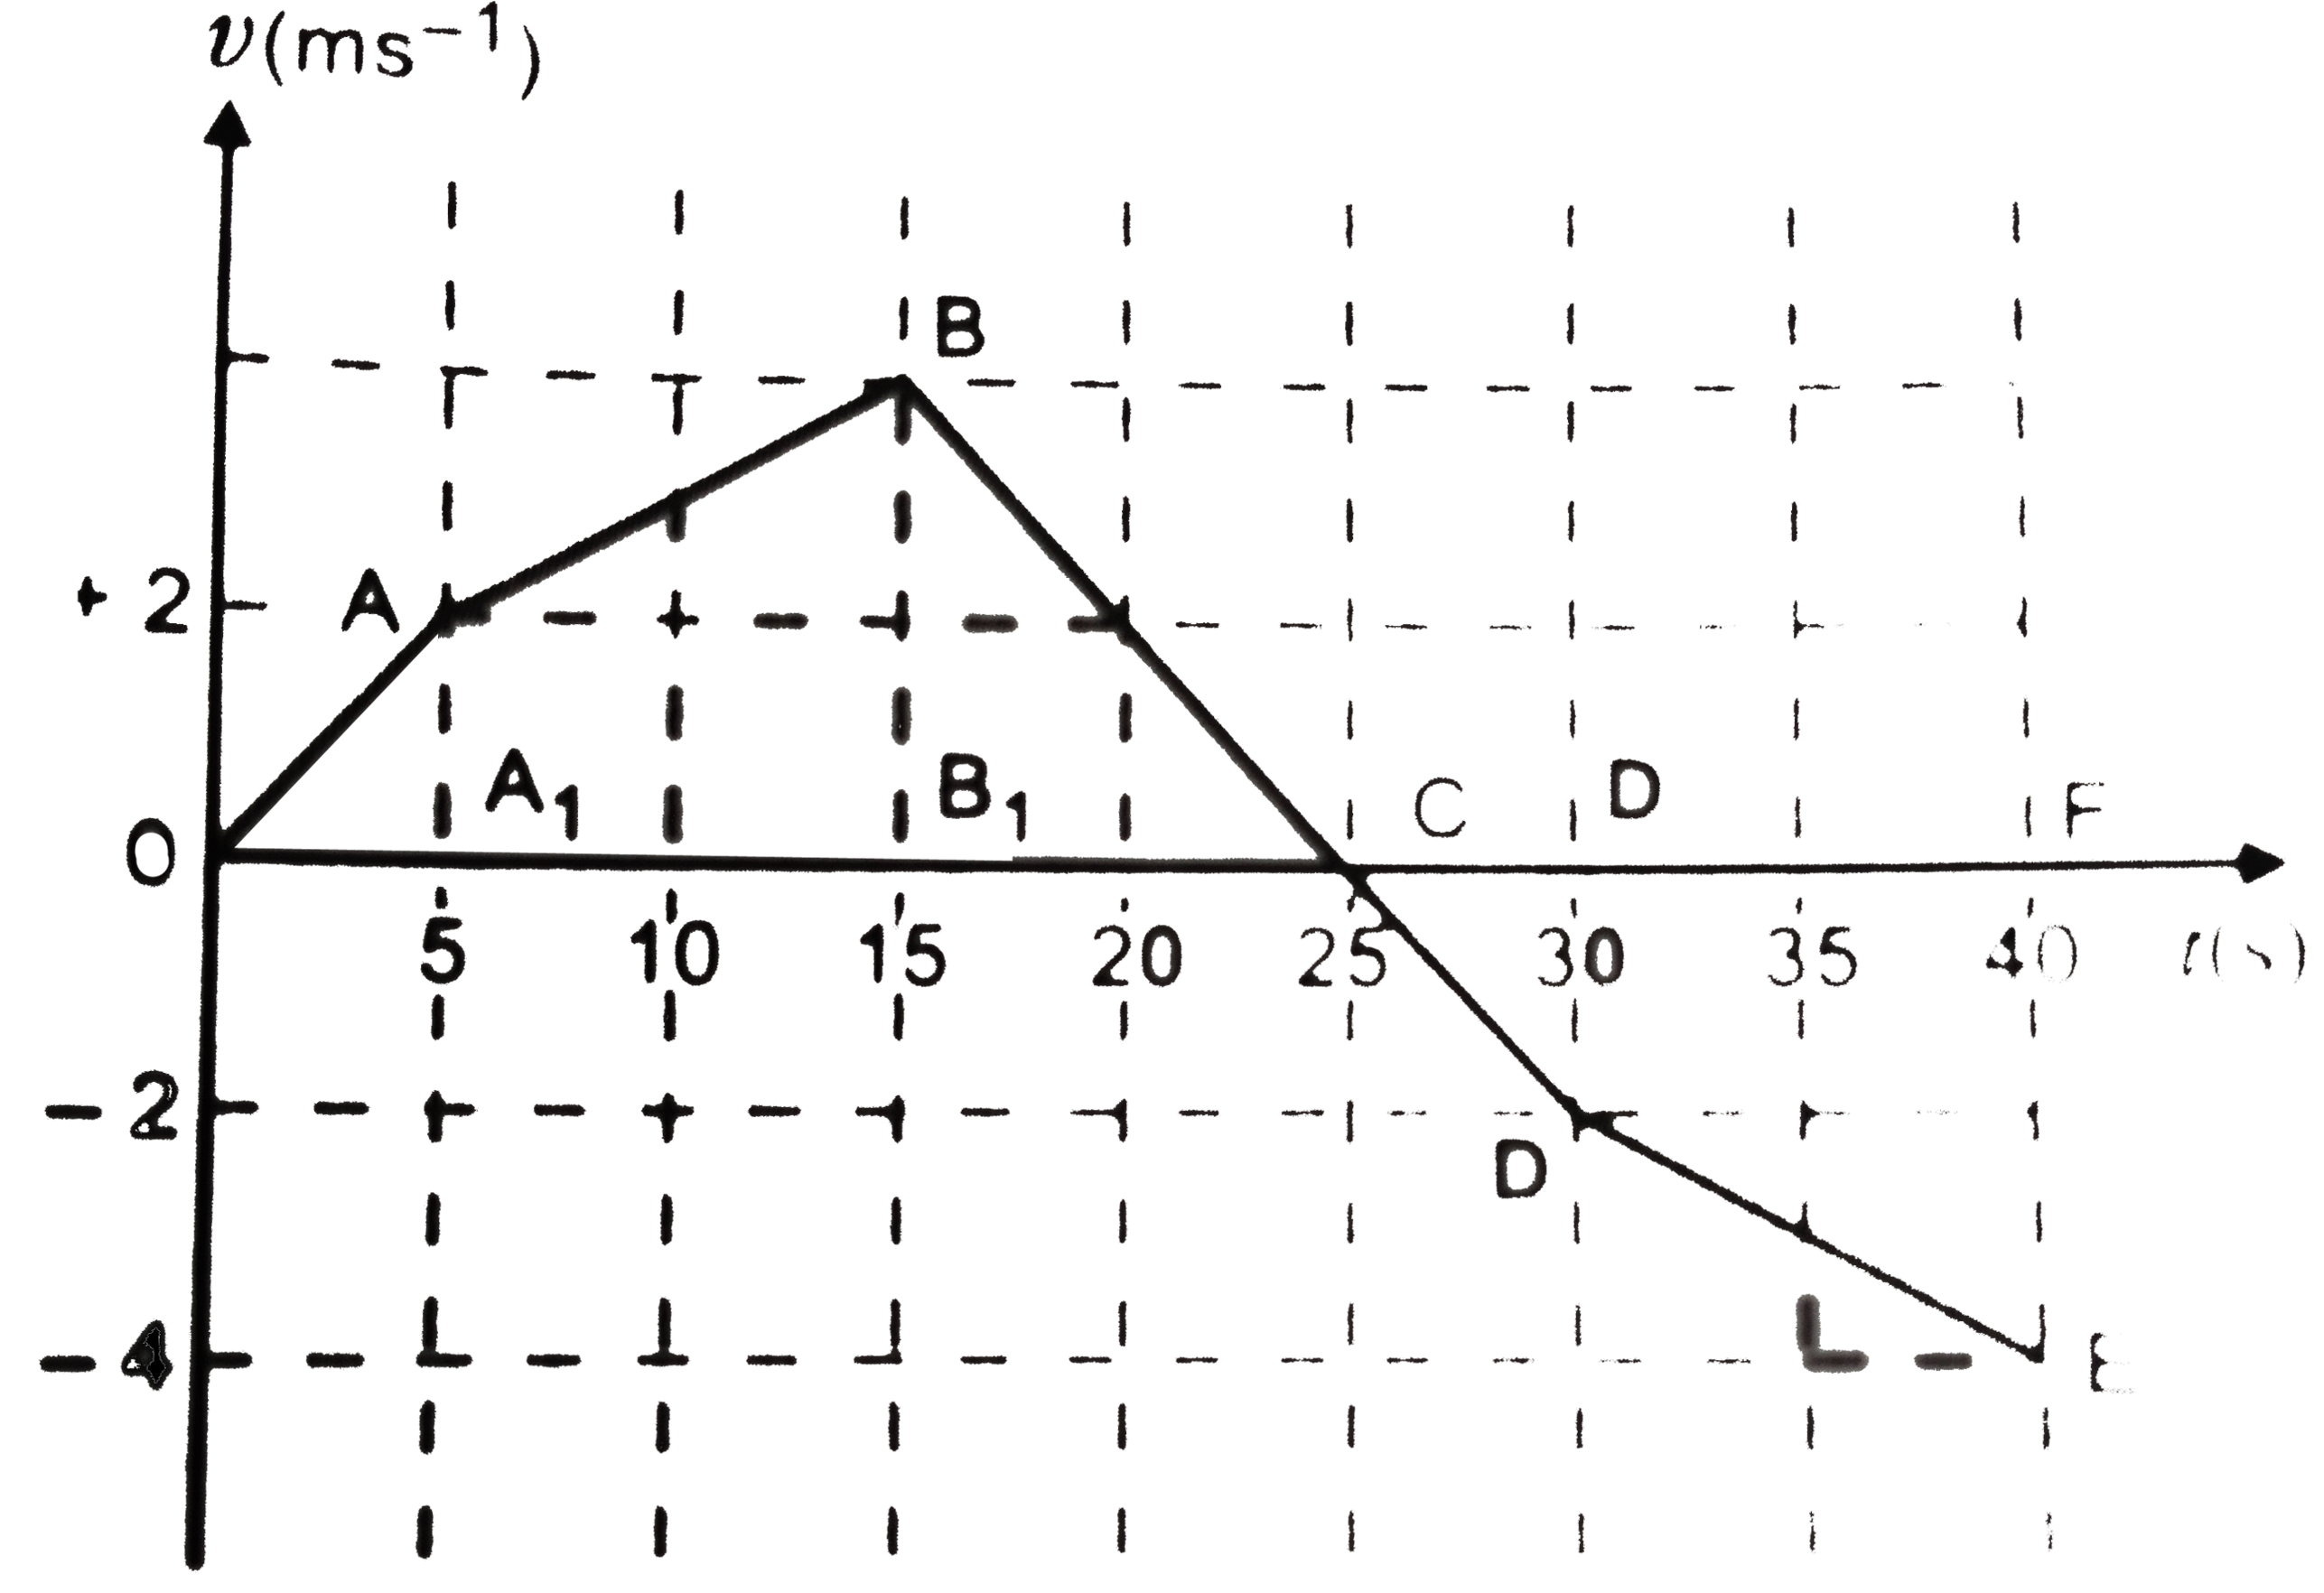
- The velocity-time graph line motion is shown in Fing. 2 (b).7. Find (a...
Text Solution
|
- When a body is subjected to a uniform acceleratuib, it alwaus moves in...
Text Solution
|
- The outside horses on a merry-go=round get more accelertion than insid...
Text Solution
|
- The three vectors not lying in a plane can never add up to give a bull...
Text Solution
|
- Asserion: Magnitude of the resultant of two vectors may be less than t...
Text Solution
|