Home
Class 11
PHYSICS
Fig. 2 (NCT). 10 . Give a speed-tiem gra...

Fig. 2 (NCT). 10 . Give a speed-tiem graph of a particle in one dimenstional motion. Three different equal intervals of time are shwon. In which interval is the average acceleration graeatest in magnitude ? In which interval is the average speed greatest ? Choosing the positive direction as the constant direction of motion, give the signs of `u` and `a` in the three intervals. What are the acclerations at teh points ` A, B , C` and ` D` ?
.

Text Solution

Verified by Experts

We know that average acceleration in a small interval of time is equal to slope of velocity-time graph in that interval .as the slope of velocity-time graph is maximum in interval `2` as compared to other intervals ` 1` and `3`, hence the magnitude of average accelration is greatest in interval `2`.
The average speed is greatest in interval `3` for obvious reasons.
In interval `1`, the slope of verlocity-time graph is positive, hence accelration a is positive, the speed (u) is positive in this interval due to obvious reasons.
In niterval `2`, the slope of velocity-tiem graph is negative, hence acceleration 9a) is negative, The speed (u) is positive in this interval dueto obvious reasons . ltbgt In interval ``, the velocity-time graph is parallelto time axis, therefore accelration 9a0 zero in this interval but (v) is positive due to obvious reasions.
AT points ` A , B` and C` the velocit-time graph is parallel to time axis . Therefore accelration (a0 iszero at all the four points.
Promotional Banner

Topper's Solved these Questions

  • KINEMATICS

    PRADEEP|Exercise Additional Exercises|13 Videos
  • KINEMATICS

    PRADEEP|Exercise Motion|25 Videos
  • KINEMATICS

    PRADEEP|Exercise Advanced Problems|20 Videos
  • GRAVIATION

    PRADEEP|Exercise Assertion-Reason Type Questions|19 Videos
  • LAWS OF MOTION

    PRADEEP|Exercise Assertion- Reason Type Questions|17 Videos

Similar Questions

Explore conceptually related problems

Fig. 2 (NCT).9 show the x-t plot of a particle in one dimensional motion. Three different equal intervals of time are shown. In which interval the average speed is greatest and in which it is the least ? Give the sign of average speed for each interval. .

s-t graph of a particle in motion is shown in Fig. Calculate Average speed

The velocity-time graph of a particle in one-dimensional motion is shown in the figure. Which of the following formulae is correct for describing the motion of the particle over the time interval t_1 to t_2 ?

Fig. 3.39 shows the acceleration - time graph for a particle in rectilinear motion. Find the average acceleration in first 20 s.

The v-t graph for a particle moving along x-axis is shown in the figure, find (a) Average velocity in the interval 0 to 8 s. (b) Average speed in the interval 0 to 8 s. (c) Average acceleration in the interval 0 to 4 s. (d) Instantaneous acceleration at t = 2.5 s.

The velocity-time graph of an object is given below. Calculate the average acceleration of the object in the time interval of 4 s to 6 s.

Menstrual cycle is repeated at an average interval of:

PRADEEP-KINEMATICS-NCRT Exercises
  1. A woman starts from her home at 9.00 a. m., walks with a speed of 5 km...

    Text Solution

    |

  2. A drunkard waking in a barrow lane takes 5 steps forward and 3 steps ...

    Text Solution

    |

  3. A jet airplance travelling at the speed of 500 km ^(-1) ejects its pr...

    Text Solution

    |

  4. A car moving aling a straight highway with speed of 126 km h^(-1) is ...

    Text Solution

    |

  5. Two trains A and B of length 400 m each are moving on two parallel t...

    Text Solution

    |

  6. On a two lane road , car (A) is travelling with a speed of 36 km h^(-...

    Text Solution

    |

  7. Two towns A and B are connected by a regular bus service with a bus le...

    Text Solution

    |

  8. A player throws a ball upwards with an initail speed of 129.4 ms^(-1) ...

    Text Solution

    |

  9. Read each staremnt below carefully and state with reasons and expample...

    Text Solution

    |

  10. A ball is dropped from a height of a height of 90 m on a floor. At eac...

    Text Solution

    |

  11. Explain clearly, with ezamples, the distaintion between : (a) magnit...

    Text Solution

    |

  12. A man walks on a straight road from his home to a market 2.5 km away ...

    Text Solution

    |

  13. In abave questions 13 and 14, we have carefully distinguished betwee...

    Text Solution

    |

  14. Look at the graphs Fig. 2 (NCT) .5.(a) to (d) carefully and state, wit...

    Text Solution

    |

  15. Fig. 2 (NCT). 6 shows x-t plot of one dismensional motion a particle....

    Text Solution

    |

  16. A police van moving on a highway with a speed of 30 km h^(-1) Fires a ...

    Text Solution

    |

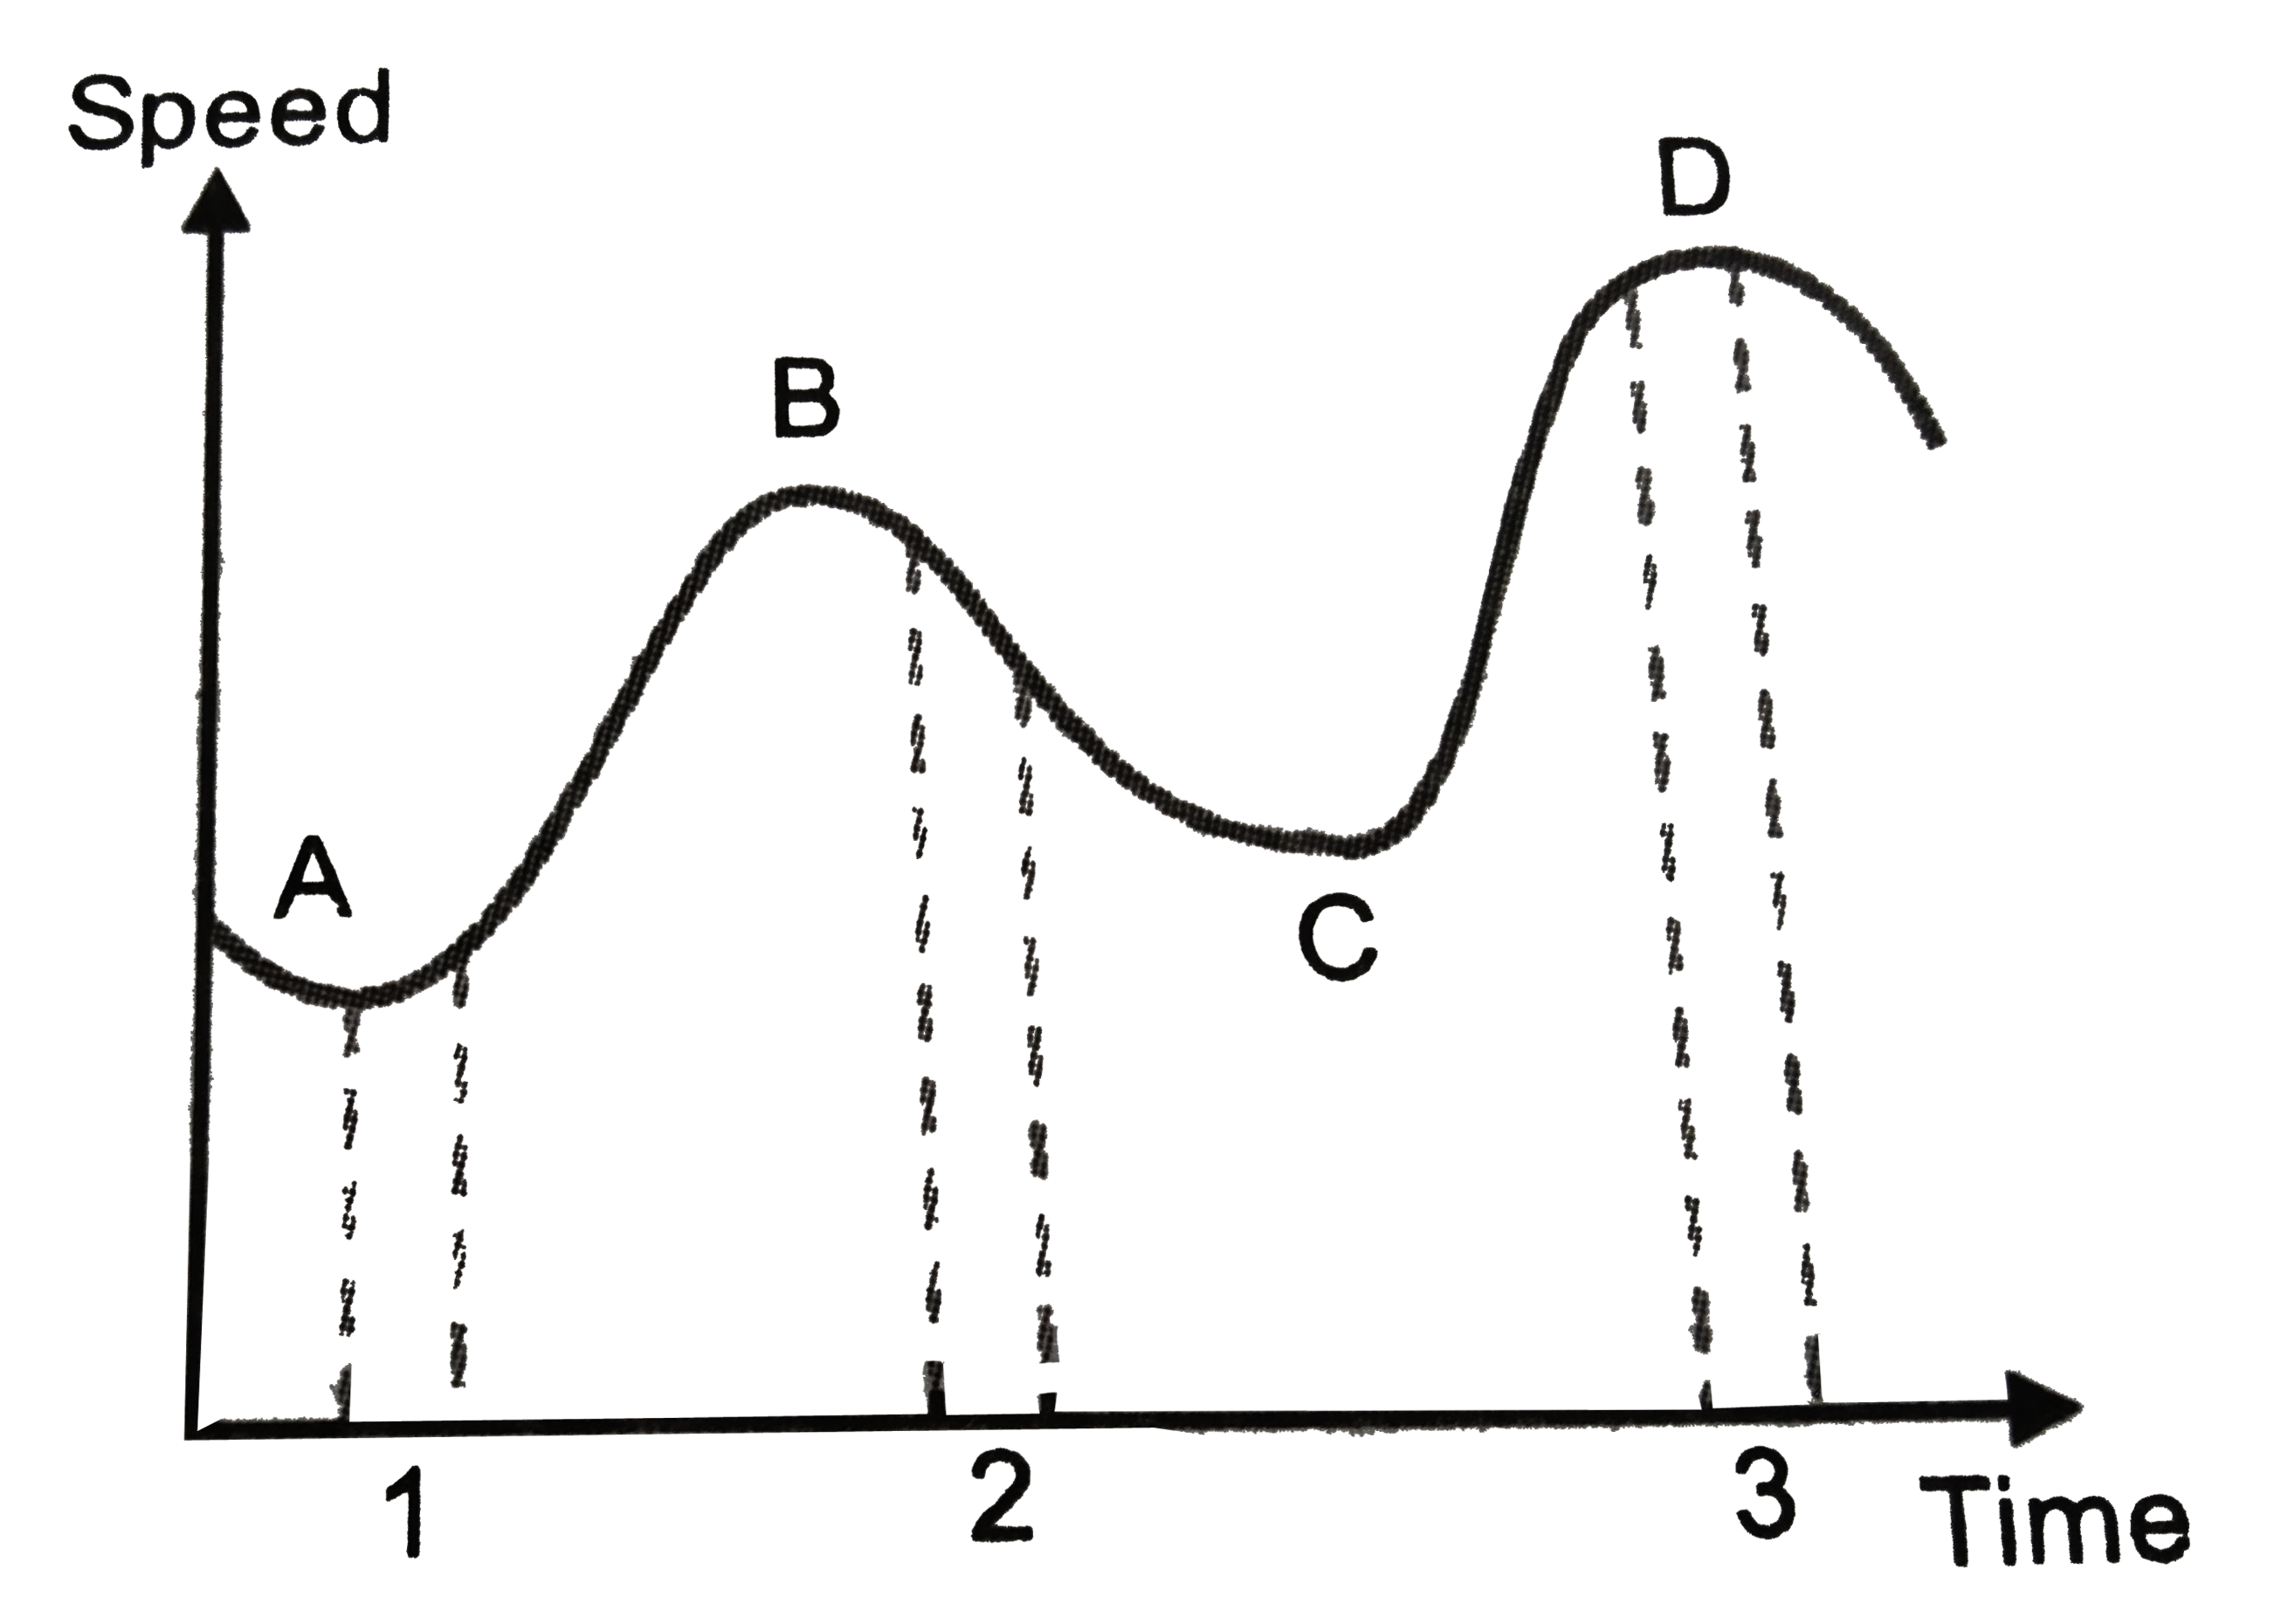
  17. Suggest a suitable phusical situation for each of the following graph ...

    Text Solution

    |

  18. Fig 2 (NCT).8 gives the x-t plot of a particle executing one dimensio...

    Text Solution

    |

  19. Fig. 2 (NCT).9 show the x-t plot of a particle in one dimensional mot...

    Text Solution

    |

  20. Fig. 2 (NCT). 10 . Give a speed-tiem graph of a particle in one dimens...

    Text Solution

    |