A
B
C
D
Text Solution
Verified by Experts
The correct Answer is:


Topper's Solved these Questions
KINETIC THEORY OF GASES AND THERMODYNAMICS
A2Z|Exercise First Law Of Thermodynamics , Internal Energy And Work Done|55 VideosKINETIC THEORY OF GASES AND THERMODYNAMICS
A2Z|Exercise Application Of First Law Of Thermodynamics In Different Situations|25 VideosKINETIC THEORY OF GASES AND THERMODYNAMICS
A2Z|Exercise Chapter Test|29 VideosGRAVITATION
A2Z|Exercise Chapter Test|29 VideosMOCK TEST
A2Z|Exercise Motion With Constant Acceleration|15 Videos
Similar Questions
Explore conceptually related problems
A2Z-KINETIC THEORY OF GASES AND THERMODYNAMICS-Ideal Gas Equation
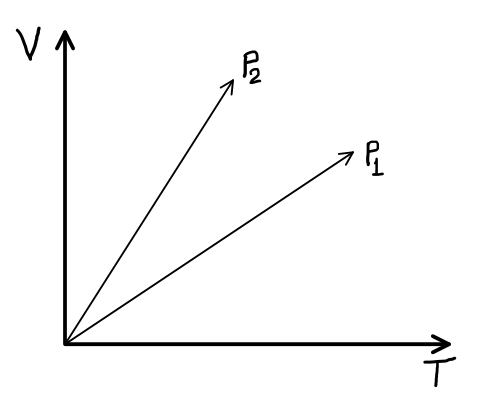
- Figure shows the volume versus temperature graph for the same mass of ...
Text Solution
|
- A volume V of air saturated with water vapour experts a pressure P. Pr...
Text Solution
|
- During an experiment, an ideal gas is found to obey an additional law ...
Text Solution
|
- A vessel containing 0.1 m^(3) of air at 76 cm of Hg is connected to an...
Text Solution
|
- Two gases A and B having the same temperature T, same pressure P and s...
Text Solution
|
- If N is Avogadro's number, then the number of molecules in 6 g of hydr...
Text Solution
|
- A gas is at on atmosphere. To what pressure it should be subjected at ...
Text Solution
|
- If the volume of air at 0^(@)C and 10 atmospheric pressure is 10 litre...
Text Solution
|
- It is required to doubled the pressure of a gas in a container at 27^(...
Text Solution
|
- A sample of a perfect gas occupies a volume V at a pressure P and obso...
Text Solution
|
- In order to increase the volume of a gas to 3 times at constant pressu...
Text Solution
|
- At a constant pressure, of the following graphs that one which represe...
Text Solution
|
- Figure shows the pressure P versus volume V graphs for a certains mass...
Text Solution
|
- Figure shows graphs of pressure vs density for an ideal gas at two tem...
Text Solution
|
- Suppose ideal gas equation follows VP^(3) = constant. Initial temperat...
Text Solution
|
- Two spherical vessel of equal volume are connected by a n arrow tube. ...
Text Solution
|
- Pressure versus temperature graphs of an ideal gas are as shown in fig...
Text Solution
|
- Density vs volume graph is shown in the figure. Find corresponding pre...
Text Solution
|
- The initial temperature of a gas is 100^(@)C. The gas is contained in ...
Text Solution
|
- A closed hollow insulated cylinder is filled with gas at 0^(@)C and al...
Text Solution
|