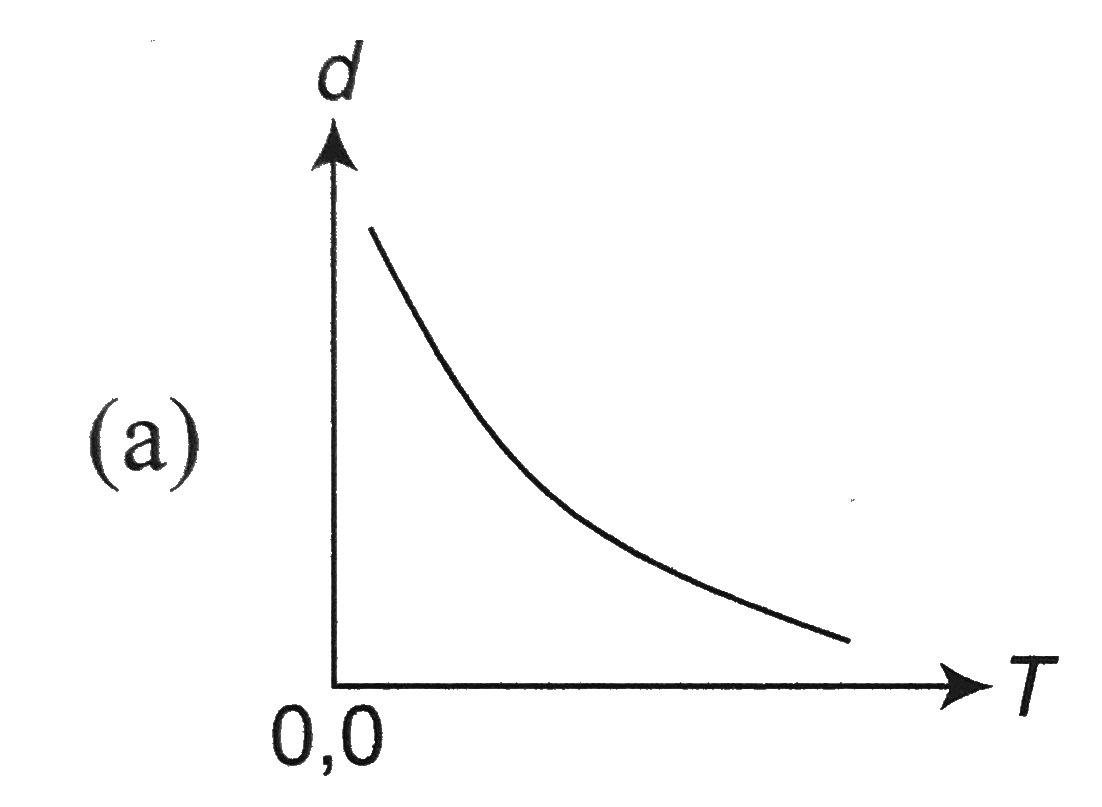
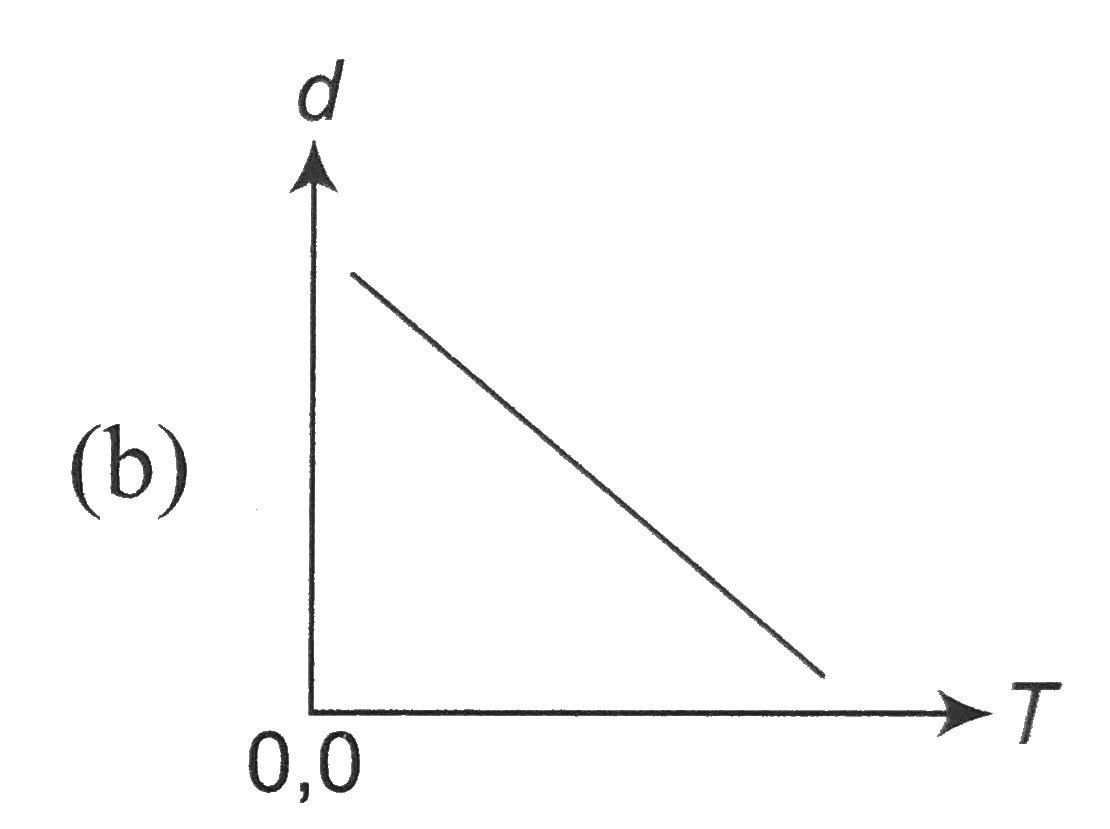
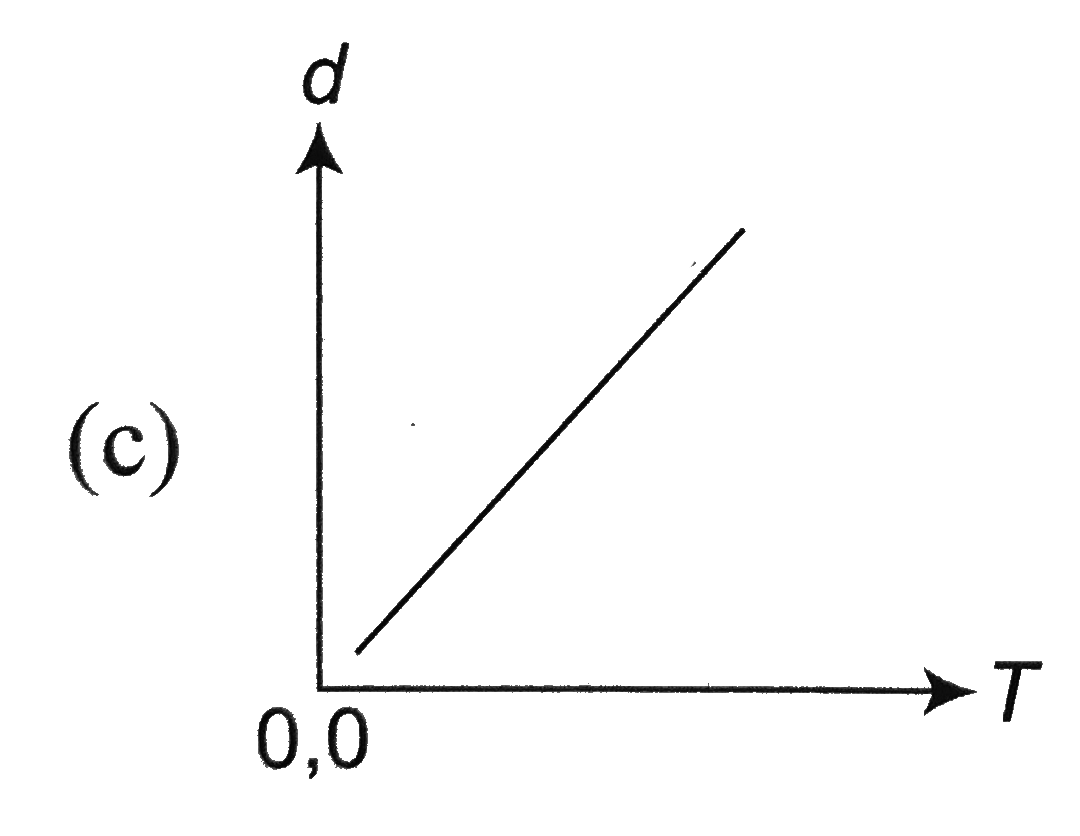
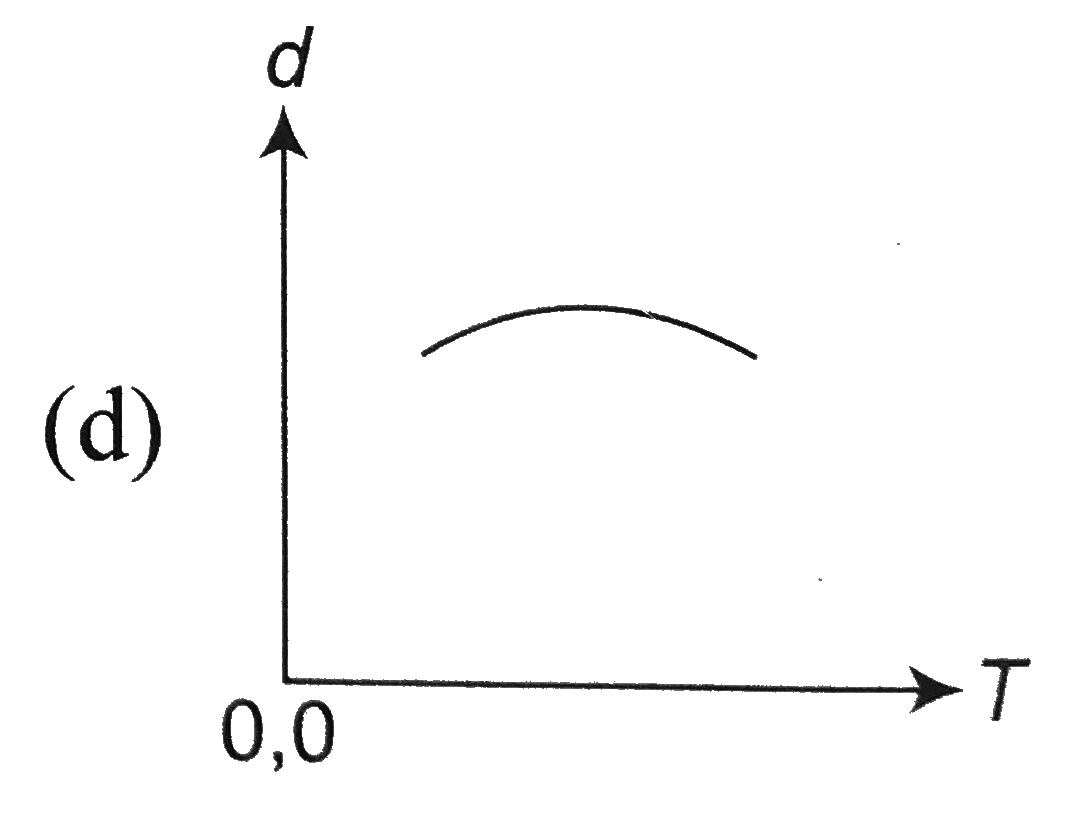
Home
Class 11
PHYSICS
At a constant pressure, of the following...

At a constant pressure, of the following graphs that one which represents the variation of the density of an ideal gas with the absolute temperature T, is

A

B

C

D

Text Solution

AI Generated Solution

The correct Answer is:
To solve the problem of how the density of an ideal gas varies with absolute temperature at constant pressure, we can follow these steps: ### Step 1: Understand the Ideal Gas Law The ideal gas law is given by the equation: \[ PV = nRT \] Where: - \( P \) = pressure - \( V \) = volume - \( n \) = number of moles - \( R \) = universal gas constant - \( T \) = absolute temperature ### Step 2: Relate Density to the Ideal Gas Law We can express the number of moles \( n \) in terms of density \( \rho \) and molar mass \( M \): \[ n = \frac{m}{M} \] Where \( m \) is the mass of the gas. The volume \( V \) can be expressed in terms of density: \[ V = \frac{m}{\rho} \] Substituting these into the ideal gas law gives: \[ P \left(\frac{m}{\rho}\right) = \frac{m}{M} RT \] ### Step 3: Simplify the Equation Rearranging the equation, we can eliminate \( m \) (assuming it is not zero): \[ P = \frac{RT \rho}{M} \] From this, we can express density \( \rho \): \[ \rho = \frac{PM}{RT} \] ### Step 4: Analyze the Relationship Between Density and Temperature At constant pressure \( P \): \[ \rho \propto \frac{1}{T} \] This indicates that density \( \rho \) is inversely proportional to the absolute temperature \( T \). ### Step 5: Determine the Graphical Representation Since density is inversely proportional to temperature, the graph of density \( \rho \) versus temperature \( T \) will be a hyperbolic curve that decreases as temperature increases. This is characteristic of an inverse relationship. ### Conclusion The correct graph representing the variation of density with absolute temperature at constant pressure will show a downward curve, indicating that as temperature increases, density decreases. ---

To solve the problem of how the density of an ideal gas varies with absolute temperature at constant pressure, we can follow these steps: ### Step 1: Understand the Ideal Gas Law The ideal gas law is given by the equation: \[ PV = nRT \] Where: - \( P \) = pressure - \( V \) = volume ...
Promotional Banner

Topper's Solved these Questions

  • KINETIC THEORY OF GASES AND THERMODYNAMICS

    A2Z|Exercise First Law Of Thermodynamics , Internal Energy And Work Done|55 Videos
  • KINETIC THEORY OF GASES AND THERMODYNAMICS

    A2Z|Exercise Application Of First Law Of Thermodynamics In Different Situations|25 Videos
  • KINETIC THEORY OF GASES AND THERMODYNAMICS

    A2Z|Exercise Chapter Test|29 Videos
  • GRAVITATION

    A2Z|Exercise Chapter Test|29 Videos
  • MOCK TEST

    A2Z|Exercise Motion With Constant Acceleration|15 Videos

Similar Questions

Explore conceptually related problems

Which of the following expression represents correctly the variation of density of an ideal gas with change in temperature ?

Which of the following graphs correctly represents the variation of beta=-(dV//dP)/V with P for an ideal gas at constant temperature?

Which of the following graphs correctly represents the variation of beta= -((dV)/(dP))//V with P for an ideal gas at constant temperature

which of the following graphs correctly represents the vatiation beta=-((dV)/(dP))_(T)//V with P for an ideal gas at constant temperature ? .

Which of the following is a graph of the relation of the density (rho) of a gas sample to the absolute tempeature keeping constant pressure.

Which graph correctly represents variation between relaxation time (t) of gas molecules with absolute temperature of gas T.

A2Z-KINETIC THEORY OF GASES AND THERMODYNAMICS-Ideal Gas Equation
  1. A sample of a perfect gas occupies a volume V at a pressure P and obso...

    Text Solution

    |

  2. In order to increase the volume of a gas to 3 times at constant pressu...

    Text Solution

    |

  3. At a constant pressure, of the following graphs that one which represe...

    Text Solution

    |

  4. Figure shows the pressure P versus volume V graphs for a certains mass...

    Text Solution

    |

  5. Figure shows graphs of pressure vs density for an ideal gas at two tem...

    Text Solution

    |

  6. Suppose ideal gas equation follows VP^(3) = constant. Initial temperat...

    Text Solution

    |

  7. Two spherical vessel of equal volume are connected by a n arrow tube. ...

    Text Solution

    |

  8. Pressure versus temperature graphs of an ideal gas are as shown in fig...

    Text Solution

    |

  9. Density vs volume graph is shown in the figure. Find corresponding pre...

    Text Solution

    |

  10. The initial temperature of a gas is 100^(@)C. The gas is contained in ...

    Text Solution

    |

  11. A closed hollow insulated cylinder is filled with gas at 0^(@)C and al...

    Text Solution

    |

  12. The air tight and smooth piston of a cylindrical vessel are connected ...

    Text Solution

    |

  13. An ideal gas has a volume of 3 V at 2 atmosphere pressure. Keeping the...

    Text Solution

    |

  14. The volume of a given mass of a gas at 27^(@)C, 1 atm is 100 cc. What ...

    Text Solution

    |

  15. A vessel of volume 1660 cm^(3) contains 0.1 "mole" of oxygen and 0.2 "...

    Text Solution

    |

  16. One litre of helium gas at a pressure 76 cm. Of Hg and temperature 27^...

    Text Solution

    |

  17. A constant pressure V(1) and V(2) are the volumes of a given mass of a...

    Text Solution

    |

  18. In which of these diagrams, the density of an ideal gas remains consta...

    Text Solution

    |

  19. V = k((P)/(T))^(0.33) where k is constant. It is an,

    Text Solution

    |

  20. The densities at points A and B are rho(0) and (3 rho(0))/(2). Find th...

    Text Solution

    |