 .
.


Similar Questions
Explore conceptually related problems
Recommended Questions
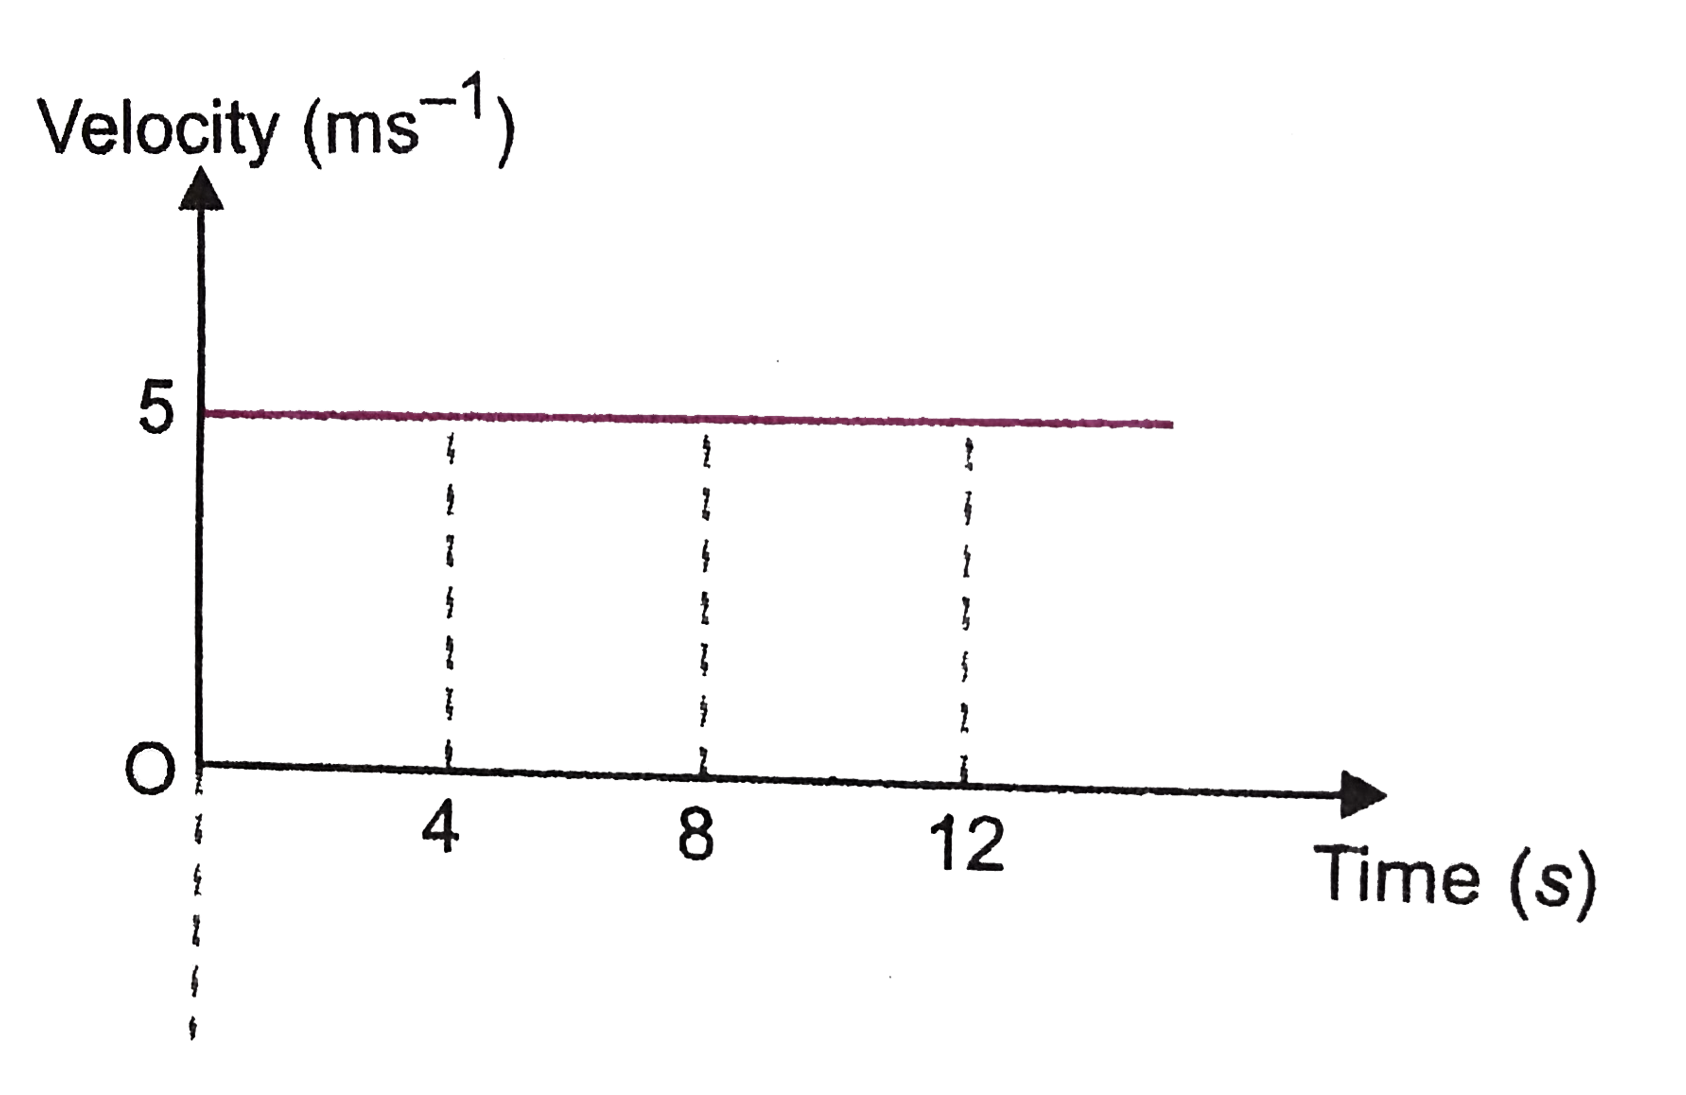
- The velocity time graph of a uniform motion of a partcile along a st. ...
Text Solution
|
- The velocity-time graph of a particle in straight line motion is veloi...
Text Solution
|
- The velocity-time graph of a particle moving along a straight line is ...
Text Solution
|
- The velocity-time graph of a particle moving along a straight line is ...
Text Solution
|
- The velocity time graph of a uniform motion of a partcile along a st. ...
Text Solution
|
- Velocity time graph for the motion of a particle along a straight line...
Text Solution
|
- The acceleration - time graph for a particle moving along x - axis is ...
Text Solution
|
- s-t graph of a particle in motion is shown in Fig. Calculate Aver...
Text Solution
|
- The acceleration time graph of a particle moving along a straight line...
Text Solution
|