Text Solution
Verified by Experts


Topper's Solved these Questions
STATISTICS
NAVNEET PUBLICATION - MAHARASHTRA BOARD|Exercise Challenging Questions|2 VideosSTATISTICS
NAVNEET PUBLICATION - MAHARASHTRA BOARD|Exercise EXAMPLES FOR PRACTICE (MCQs)|35 VideosSTATISTICS
NAVNEET PUBLICATION - MAHARASHTRA BOARD|Exercise PRACTICE SET 6.5|3 VideosSIMILARITY
NAVNEET PUBLICATION - MAHARASHTRA BOARD|Exercise SUBJECTIVE TYPE|20 VideosTHEOREMS
NAVNEET PUBLICATION - MAHARASHTRA BOARD|Exercise CIRCLE|15 Videos
Similar Questions
Explore conceptually related problems
NAVNEET PUBLICATION - MAHARASHTRA BOARD-STATISTICS-PRACTICE SET 6.6
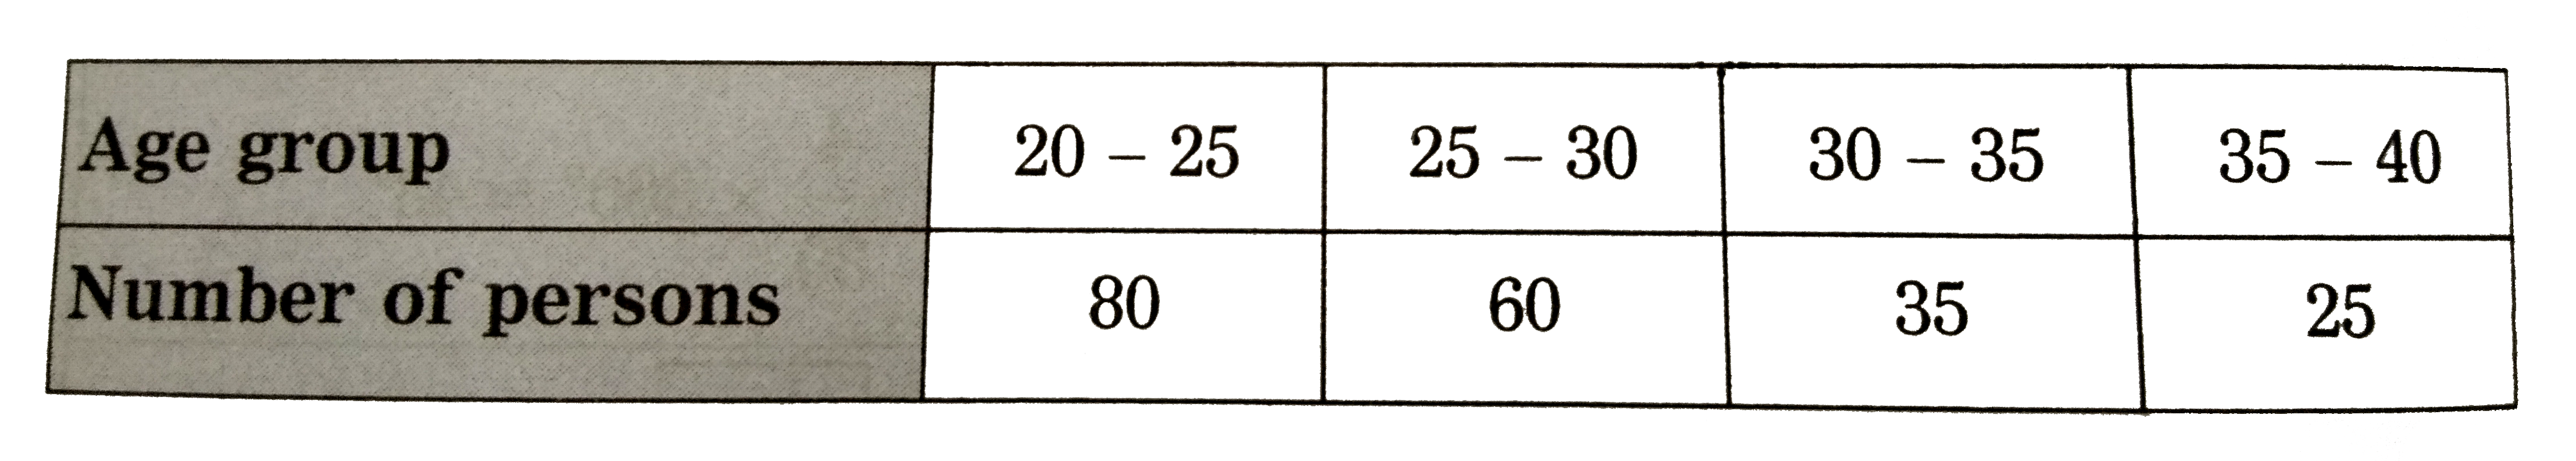
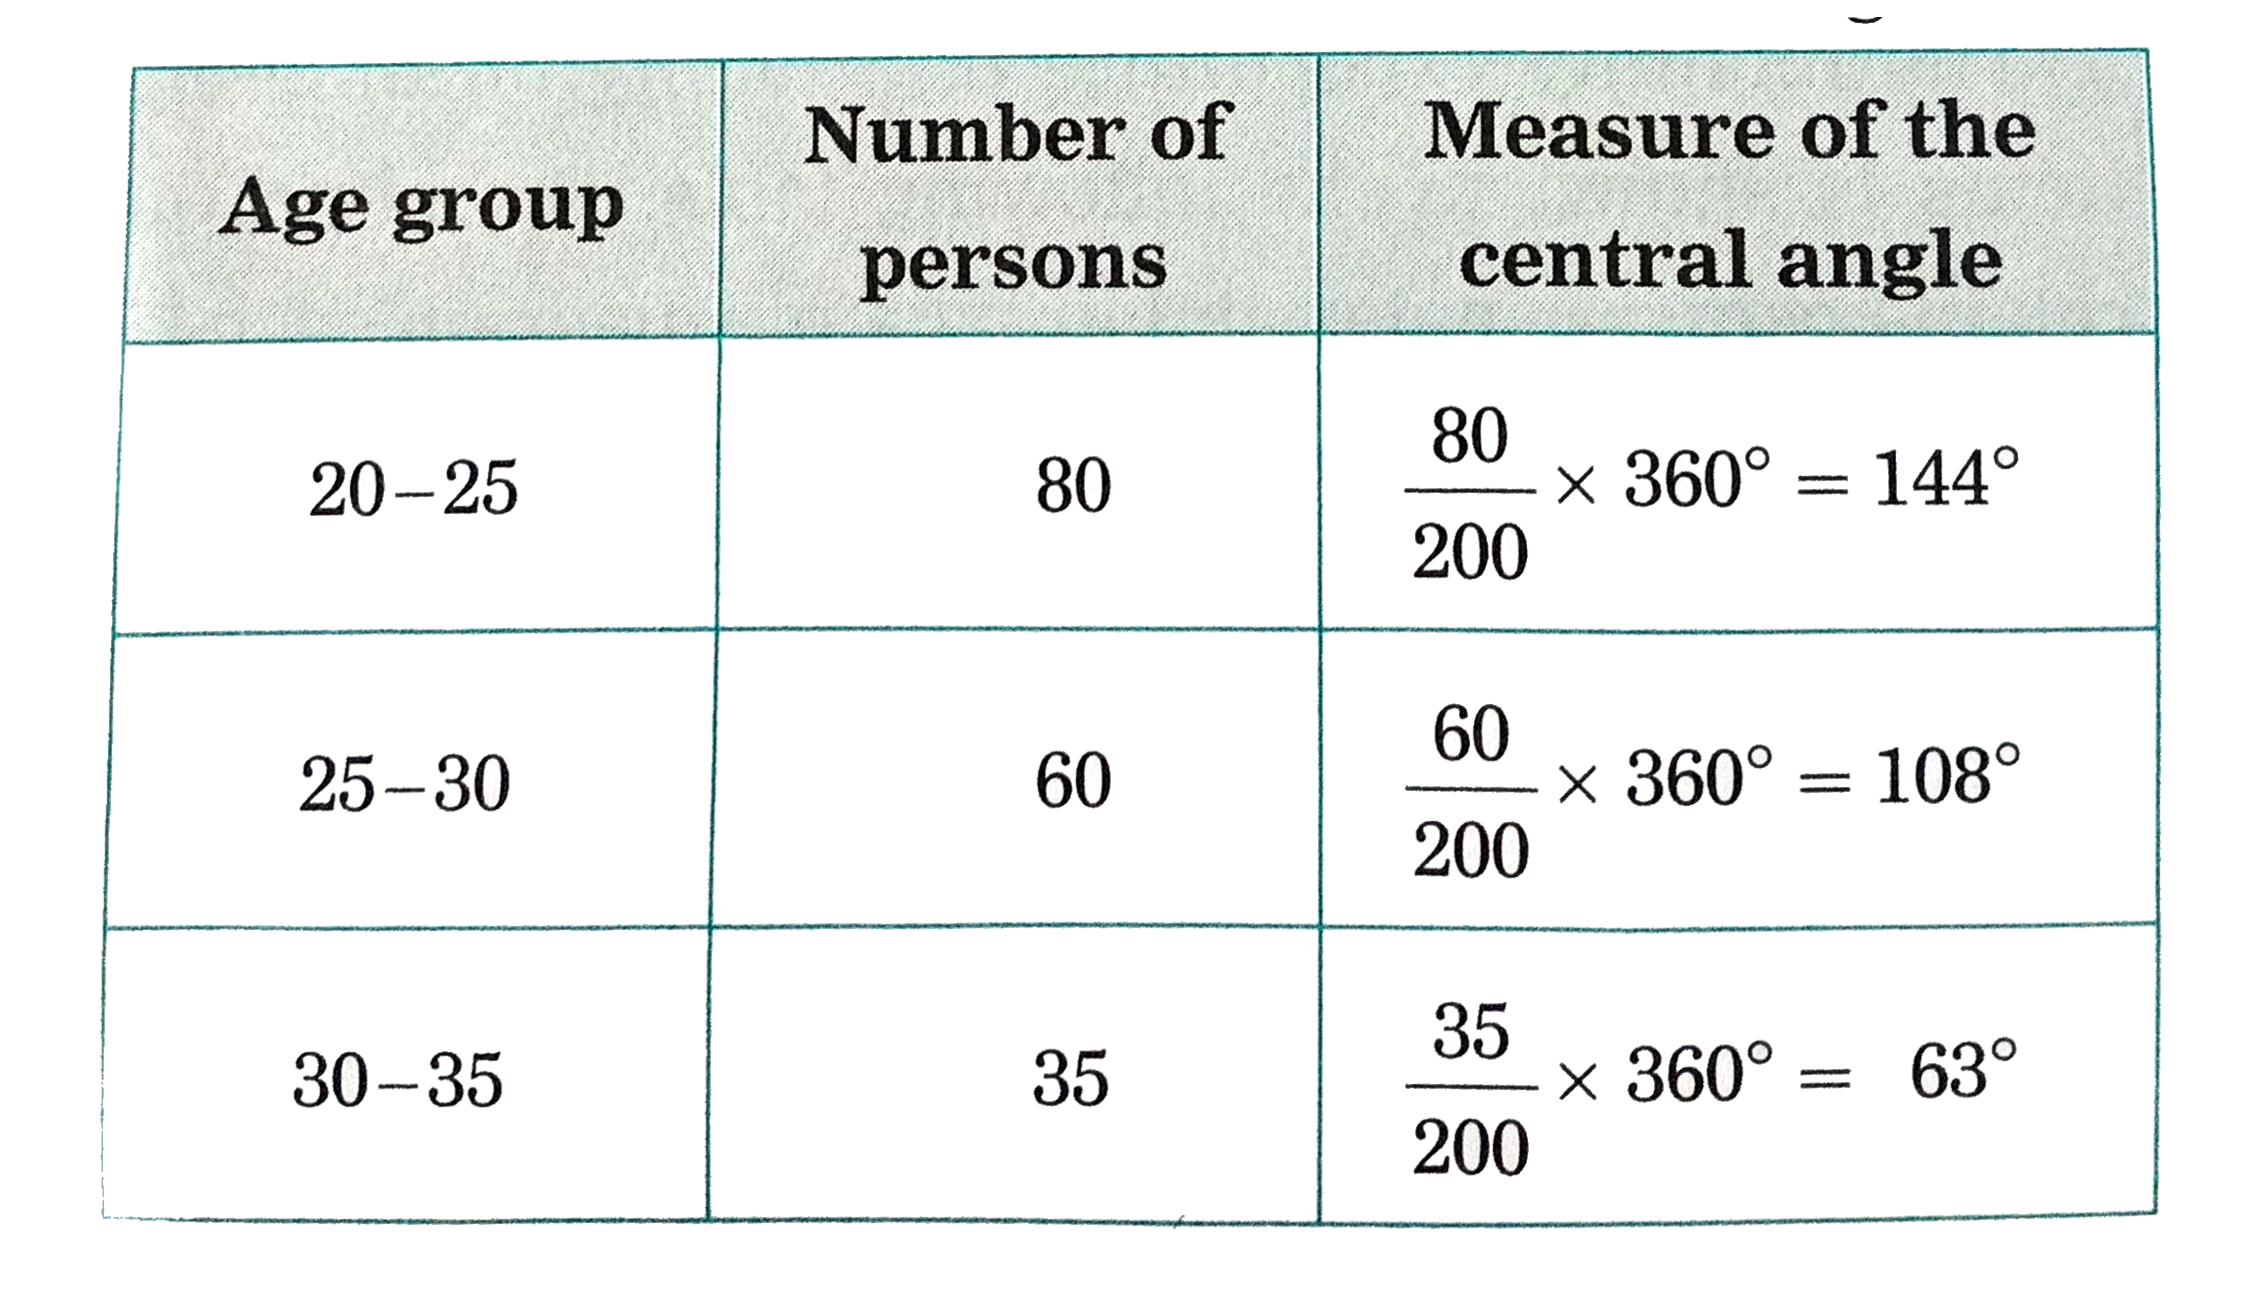
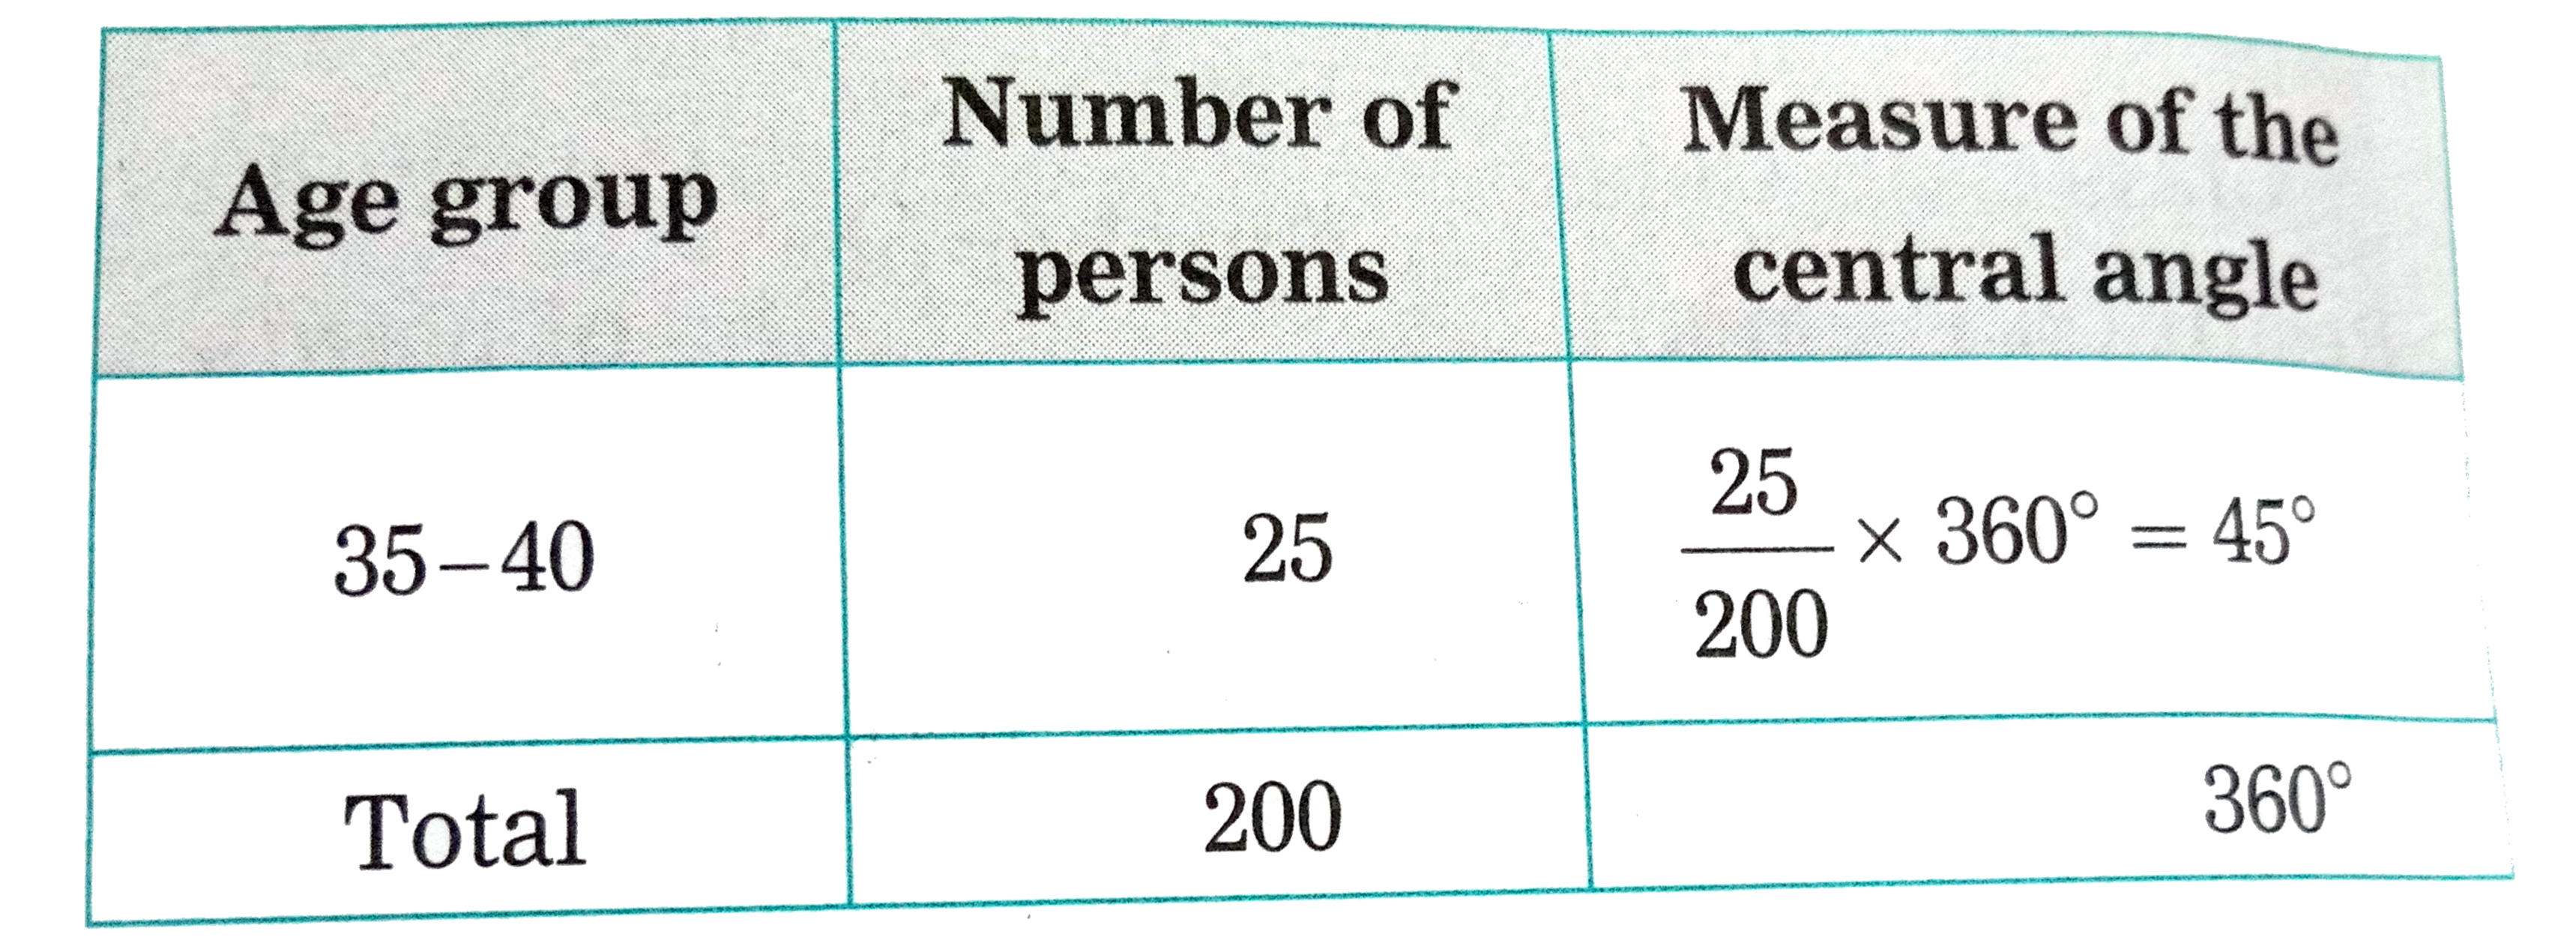
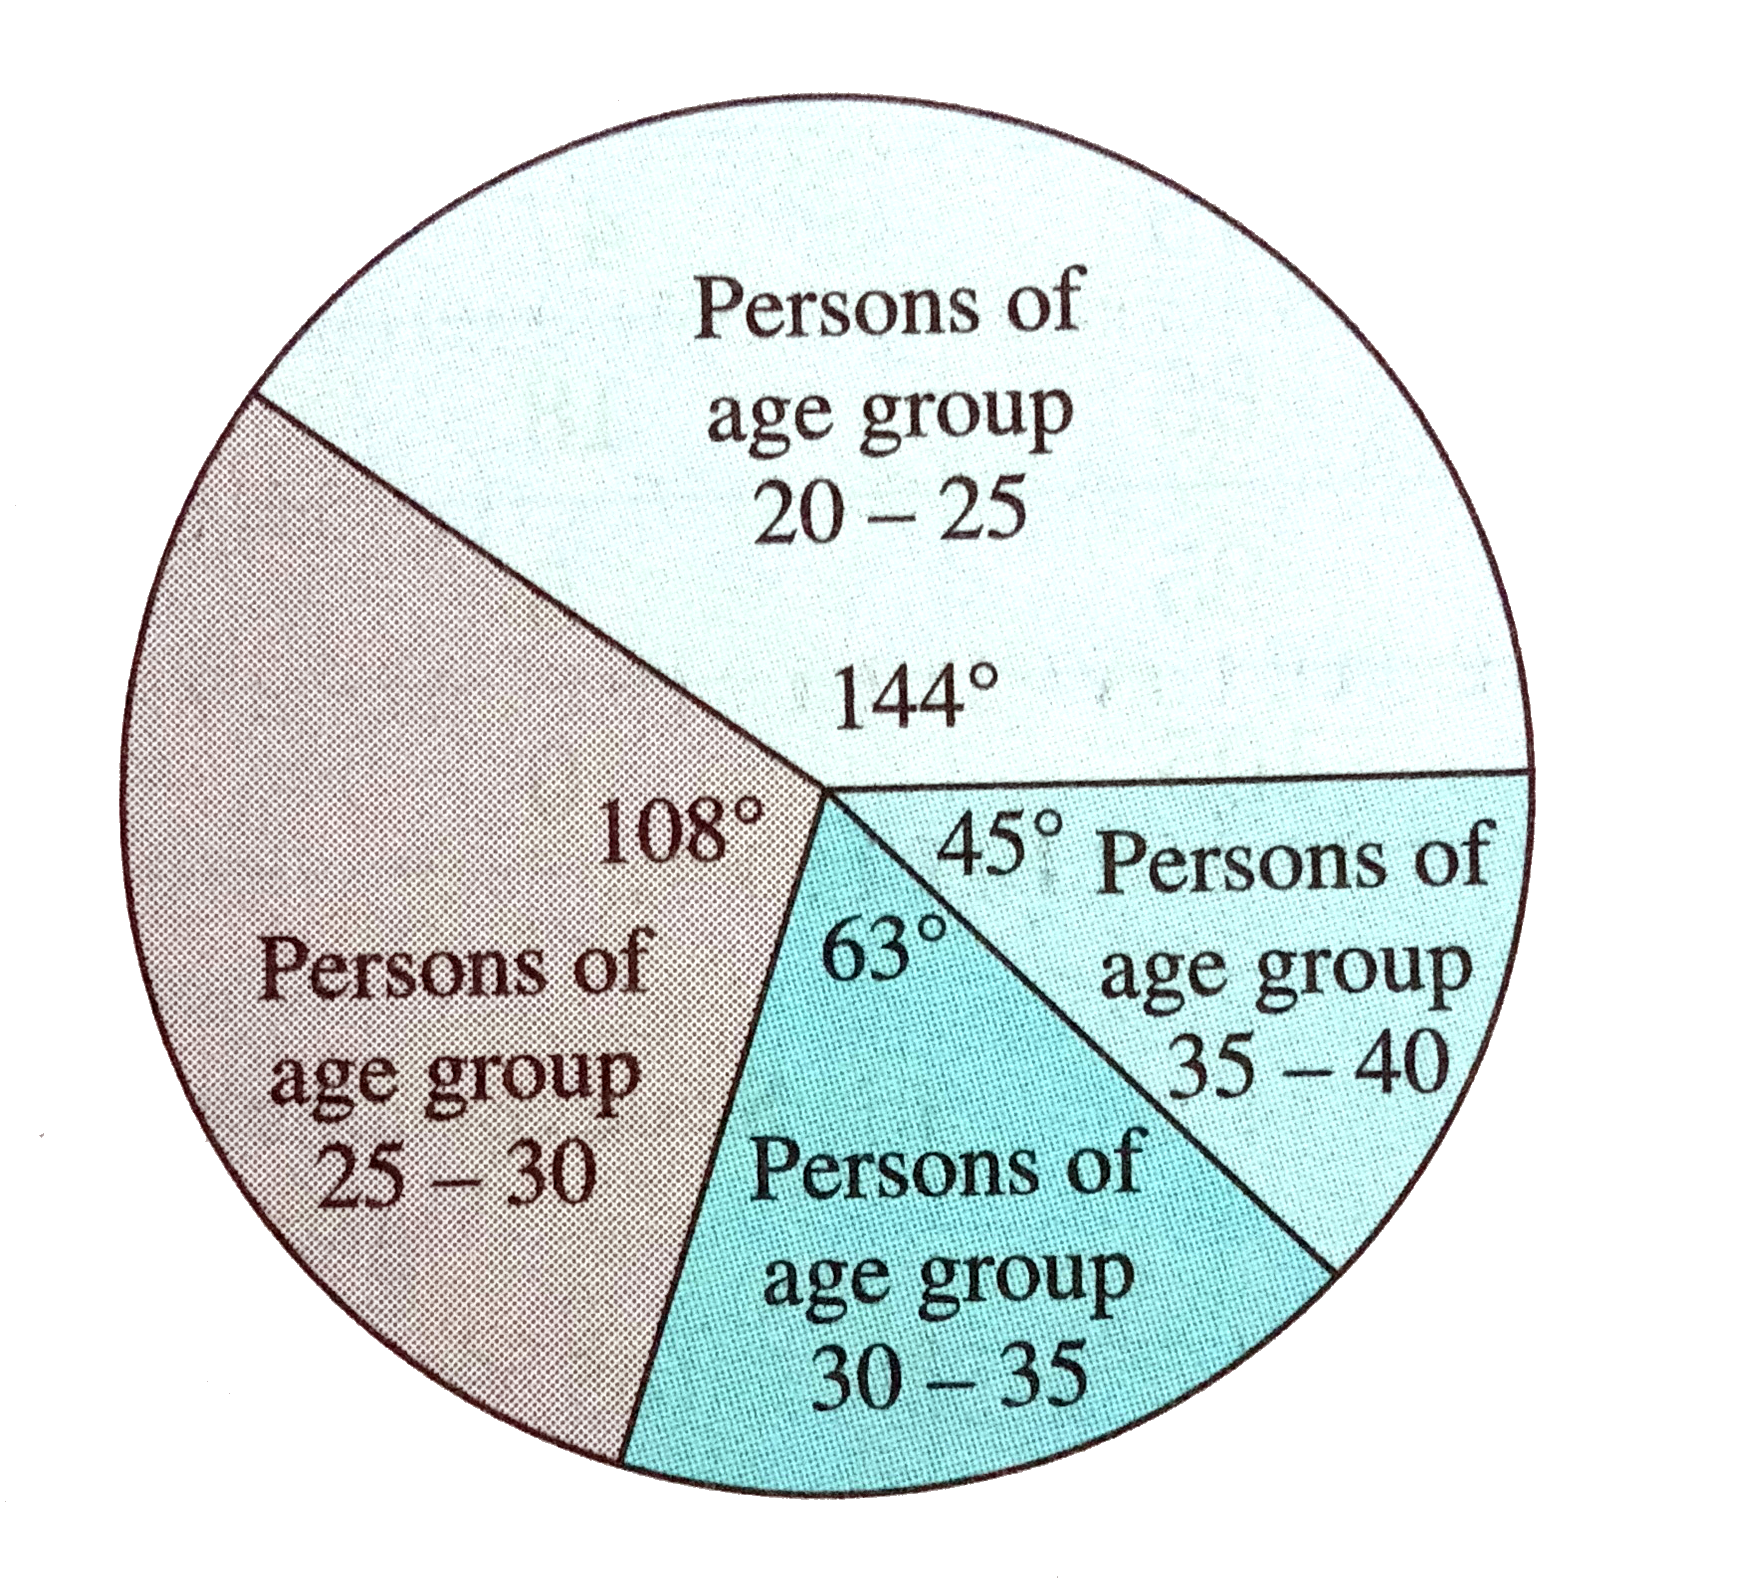
- The age group of the number of persons in the age group who donated bl...
Text Solution
|
- The marks obtained by a student in defferent subjects are shown. Draw ...
Text Solution
|
- In a tree plantation programme, the number of trees planted by student...
Text Solution
|
- The following table shows the percentages of demands for different fru...
Text Solution
|
- The pie diagram in figure, shows the proportions of different workers ...
Text Solution
|
- The annual investments of a family are shown in the pie diagram. Answe...
Text Solution
|