Home
Class 10
MATHS
The following table shows the number of ...

The following table shows the number of patients of differents age groups admitted to a hospital for treatement on a day. Find the median age of the patients.

Text Solution

Verified by Experts

The correct Answer is:
Median age of patients is 38 years.
Promotional Banner

Topper's Solved these Questions

  • STATISTICS

    NAVNEET PUBLICATION - MAHARASHTRA BOARD|Exercise Challenging Questions|2 Videos
  • SIMILARITY

    NAVNEET PUBLICATION - MAHARASHTRA BOARD|Exercise SUBJECTIVE TYPE|20 Videos
  • THEOREMS

    NAVNEET PUBLICATION - MAHARASHTRA BOARD|Exercise CIRCLE|15 Videos

Similar Questions

Explore conceptually related problems

The following table shows ages of 300 patients getting medical treatment in a hospital on a particular day: Find the median age of the patient.

The following table shows the ages of the patients admitted in a hospital during a year: Find the mode and the mean of the data given above.Compare and interpret the two measures of central tendency.

The following table shows ages of 200 patients (in years) and the number of patients getting medical tretment on a particular day in a hospital in a day. Find the median age of a patient.

The following frequency dsitribution table gives the ages of 80 patients treated in a hospital during a month. Find the mode of the ages of the patients.

The following table shows the number of patients discharged from a hospital with HIV diagnosis in different years: Years:,2002,2003,2004,2005,2006 No.of Patients: 150 ,170,195,225,230 Represent this information by a graph.

COVID-19 Pandemic The COVID-19 pandemic, also known as coronavirus pandemic, is an ongoing pandemic of coronavirus disease caused by the transmission of severe acute respiratory syndrome coronavirus 2 (SARS-CoV-2) among humans. The following tables shows the age distribution of case admitted during a day in two different hospitals . Refer to table 2. The median of the given data is

The following frequency distribution table gives the ages of 200 patients treated in a hospital in a weak. Find the mode of ages of the patients.

The following table shows the ages of persons who visited a museum on a certain day. Find the median age of the persons visitng the museum.

NAVNEET PUBLICATION - MAHARASHTRA BOARD-STATISTICS-EXAMPLES FOR PRACTICE (MCQs)
  1. Find the value of Sigmaf(i) d(i) for the following information. (i) ...

    Text Solution

    |

  2. Find the value of bar u for the following information : (i) A = 22.5...

    Text Solution

    |

  3. Find the mean of the data given in the following table. {:("Class",0...

    Text Solution

    |

  4. The following table shows the percentage of vehicles passing a signal....

    Text Solution

    |

  5. The age group of the number of persons in the age group who donated bl...

    Text Solution

    |

  6. Find barX by step deviation method : Given : A = 2200. " "Sigma ...

    Text Solution

    |

  7. The mean of the data by step deviation method is Rs. 1390. Find the as...

    Text Solution

    |

  8. The mean of the data by step deviation method is 1896 . Find the value...

    Text Solution

    |

  9. For each of the following frequencies distribution draw histogram : (...

    Text Solution

    |

  10. A survey was conducted in Aadarsh Vidyalaya to know the inclination ...

    Text Solution

    |

  11. The cost of living index and the number of weeks are given in the foll...

    Text Solution

    |

  12. Marks ( out of 50) obtaned in Mathematics by 100 students is given in ...

    Text Solution

    |

  13. Calculate the mean for the following data :

    Text Solution

    |

  14. Calculate the mean of the following frequency distribution : (Use step...

    Text Solution

    |

  15. Find the mode for the following :

    Text Solution

    |

  16. Draw a frequency polygon from the information given in the following t...

    Text Solution

    |

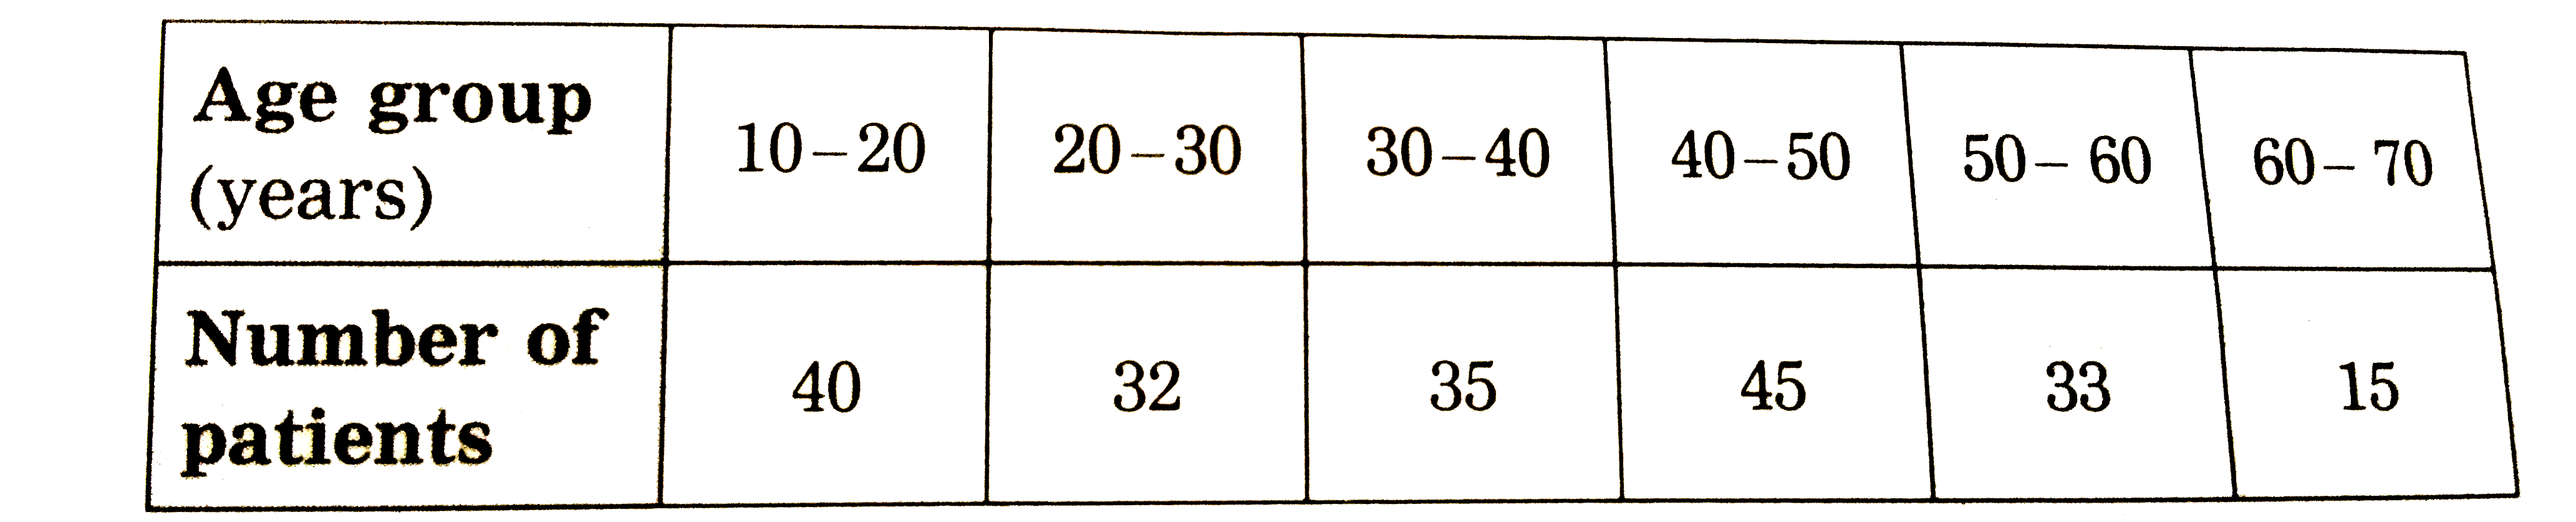
  17. The following table shows the number of patients of differents age gro...

    Text Solution

    |

  18. The number of hours spent by a school boy in different activities in a...

    Text Solution

    |

  19. The percentage of expenditure on different heads in a budget of a stat...

    Text Solution

    |

  20. The following table is based on the marks of the first term examinatio...

    Text Solution

    |