


Similar Questions
Explore conceptually related problems
Recommended Questions
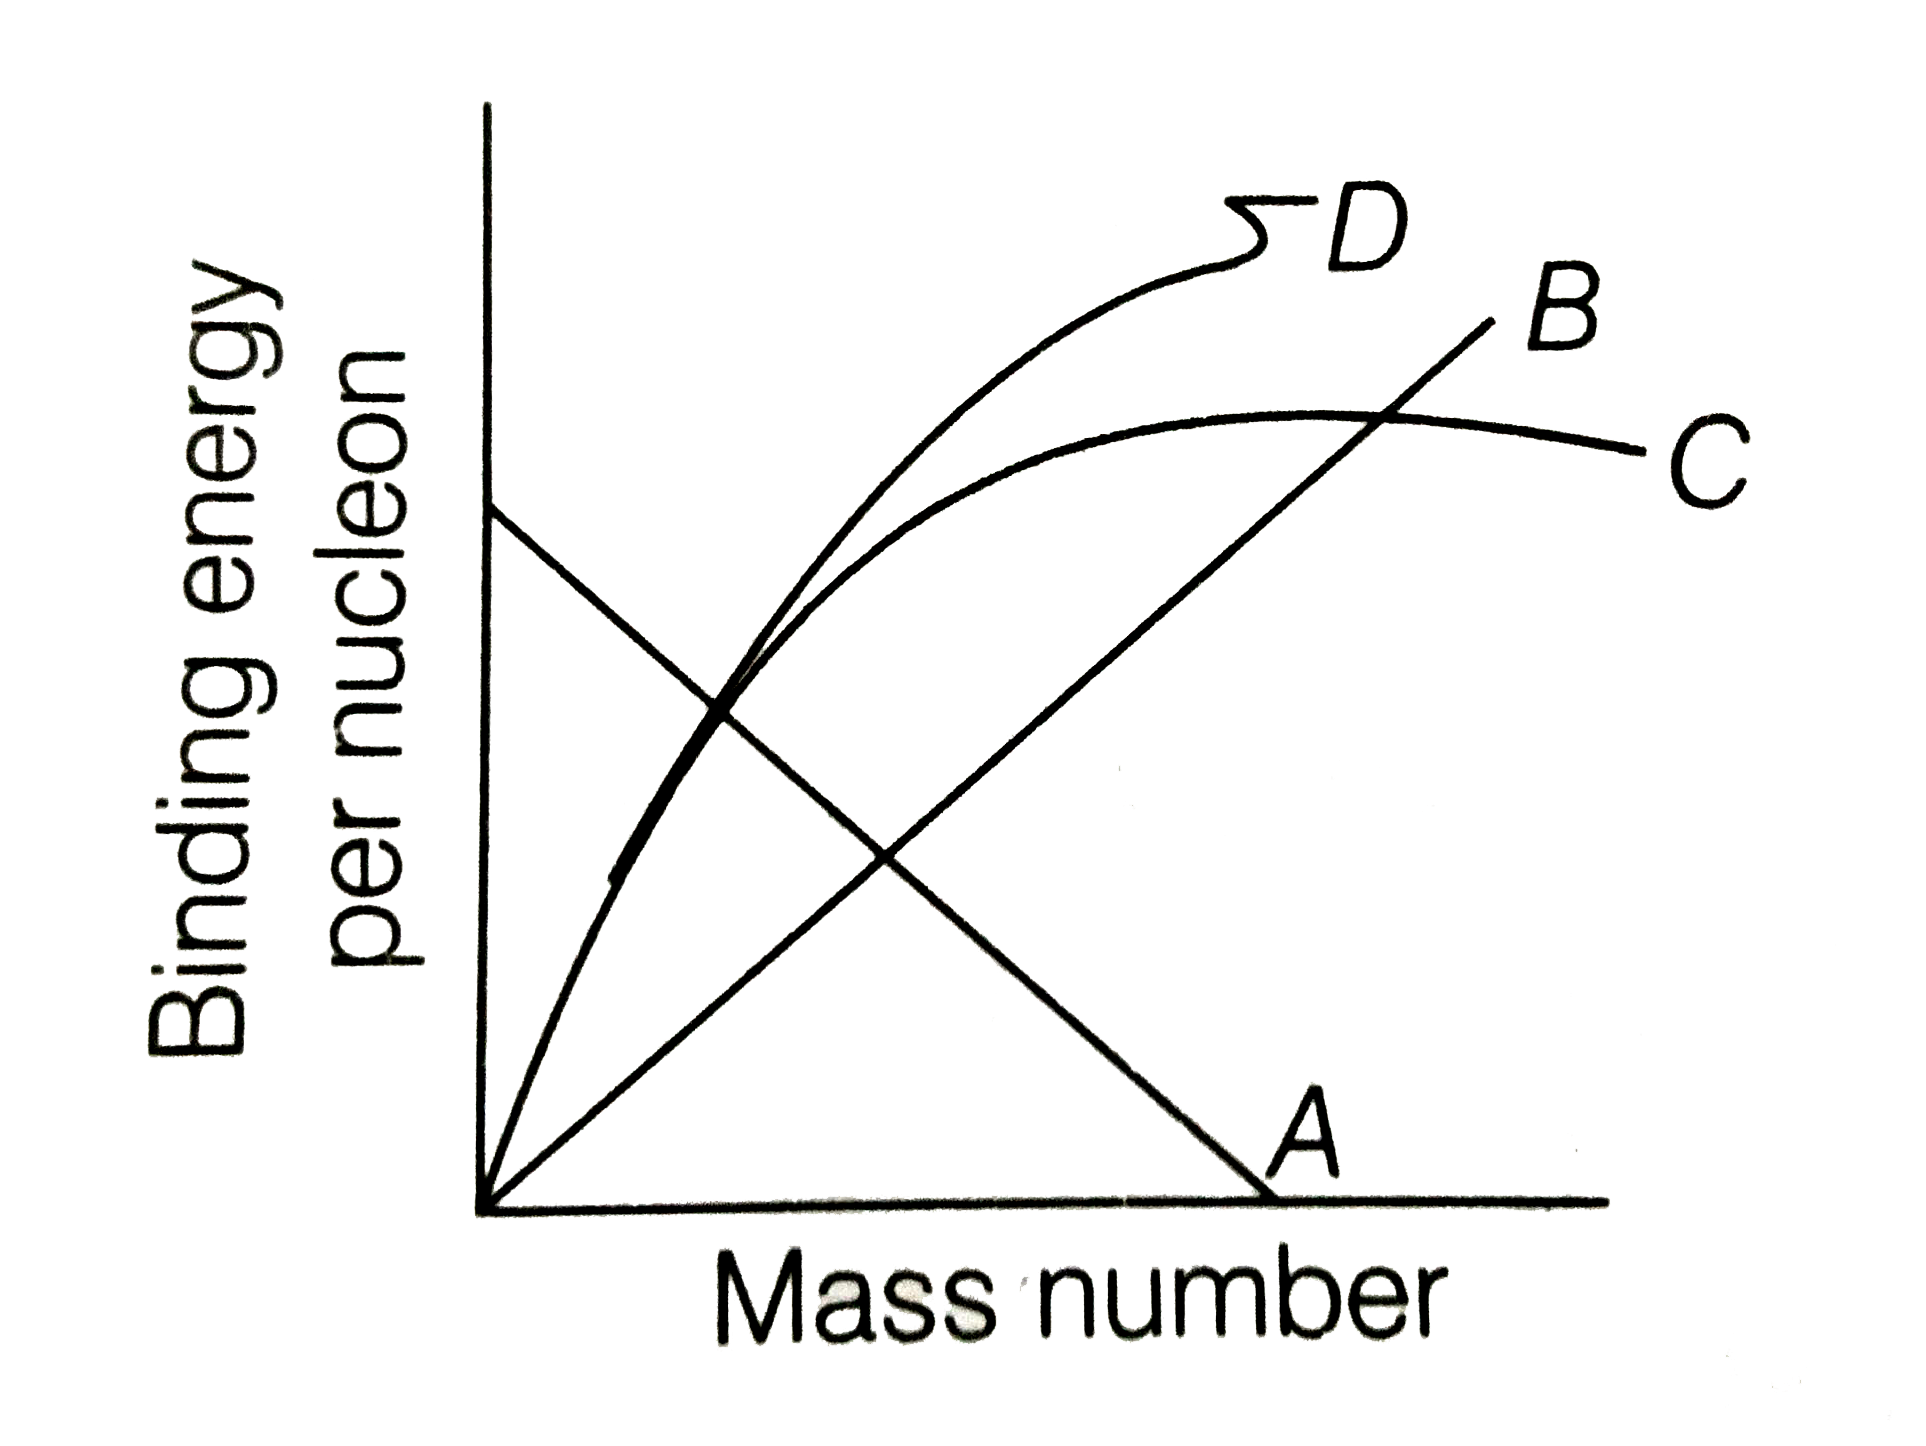
- Binding energy per nucleon plot against the mass number for stable nuc...
Text Solution
|
- The binding energy per nucleon, for nuclei with atomic mass number A g...
Text Solution
|
- Maximum value of binding energy per nucleon for most stable nuclei is
Text Solution
|
- For atomic nuclei, the binding energy per nucleon
Text Solution
|
- Draw the graph showing thervariation of binding energy per nucleon wit...
Text Solution
|
- Binding energy per nucleon plot against the mass number for stable nuc...
Text Solution
|
- विभिन्न नाभिको की द्रव्यमान संख्या के साथ प्रति न्यूक्लिऑन बंधन...
Text Solution
|
- Draw the curve showing the variation of binding energy per nucleon as ...
Text Solution
|
- Draw the graph showing the variation of binding energy per nucleon wit...
Text Solution
|