A
B
C
D
Text Solution
Verified by Experts
The correct Answer is:


Topper's Solved these Questions
Similar Questions
Explore conceptually related problems
P BAHADUR-CHEMICAL KINETICS-Exercise 9
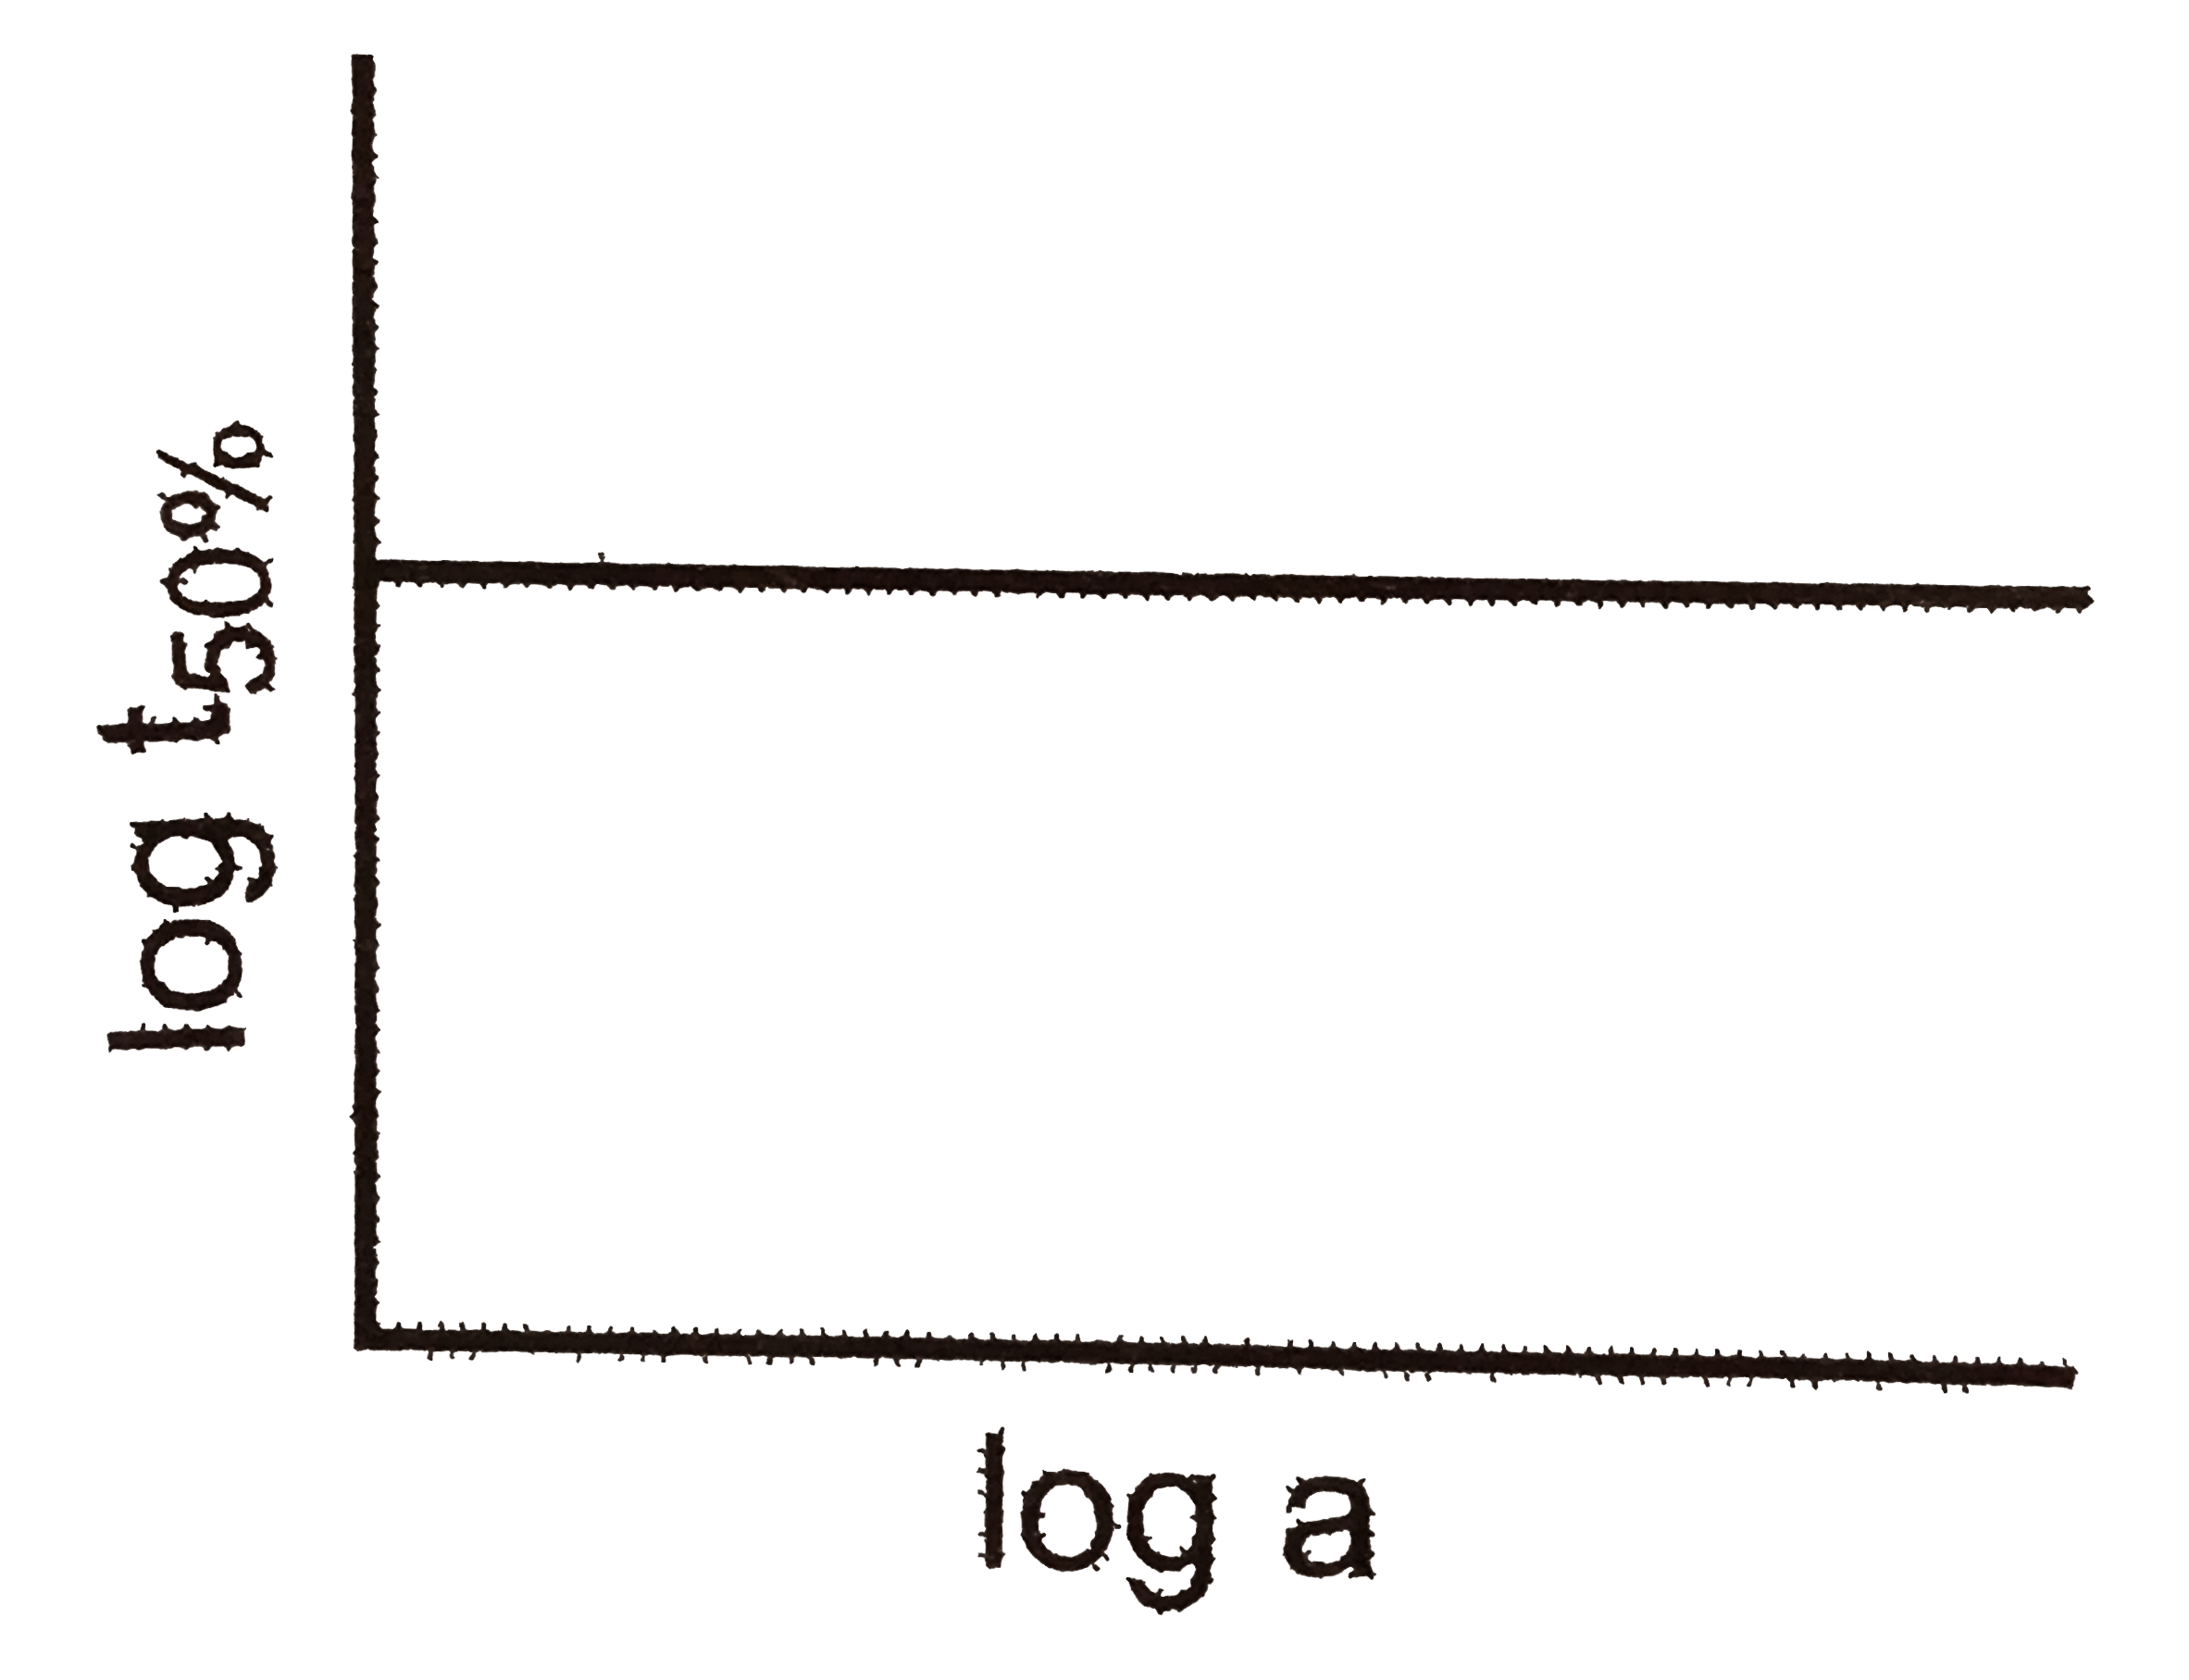
- A graph plotted between log t(50%) vs log concentration is a straight ...
Text Solution
|
- For the reaction 2NO(2)+F(2) rarr 2NO(2)F, the experimental rate law i...
Text Solution
|
- The rate of decomposition for methyl nitrite and ethyl nitrite can be ...
Text Solution
|
- A given sample of milk turns sour at room temperature (20^(@) C) in 64...
Text Solution
|
- The catalytic decomposition of formic acid may take place in two ways:...
Text Solution
|
- A 22.4 litre flask contains 0.76 mm of ozone at 25^(@)C. Calculate: ...
Text Solution
|
- The complex [Co(NH(3))(5)F]^(2+) reacts with water according to the eq...
Text Solution
|
- The conversion of trypsinogen (A) into trypsin (B) is an autocatalytic...
Text Solution
|
- Arsine decomposes on heating to give As and H(2). The decomposition st...
Text Solution
|
- A vessel contains dimethyl ether at a pressure of 0.4 atm. Dimethyl et...
Text Solution
|
- Decomposition of H(2)O(2) is a first-order reaction. A solution of H(2...
Text Solution
|
- In a certainreaction B^(n+) is getting converted to B^((n+4)+) in solu...
Text Solution
|
- For a reversible first-order reaction, A underset(K(2))overset(K(1))...
Text Solution
|
- For a reversible reaction C hArr D, heat of reaction at constant volum...
Text Solution
|