A
B
C
D

Text Solution
Verified by Experts
The correct Answer is:


Topper's Solved these Questions
Similar Questions
Explore conceptually related problems
PRADEEP-PROPERTIES OF BULK MATTER-Multiple choice questions
- In the experiment to determine Young's modulus of the material of a w...
Text Solution
|
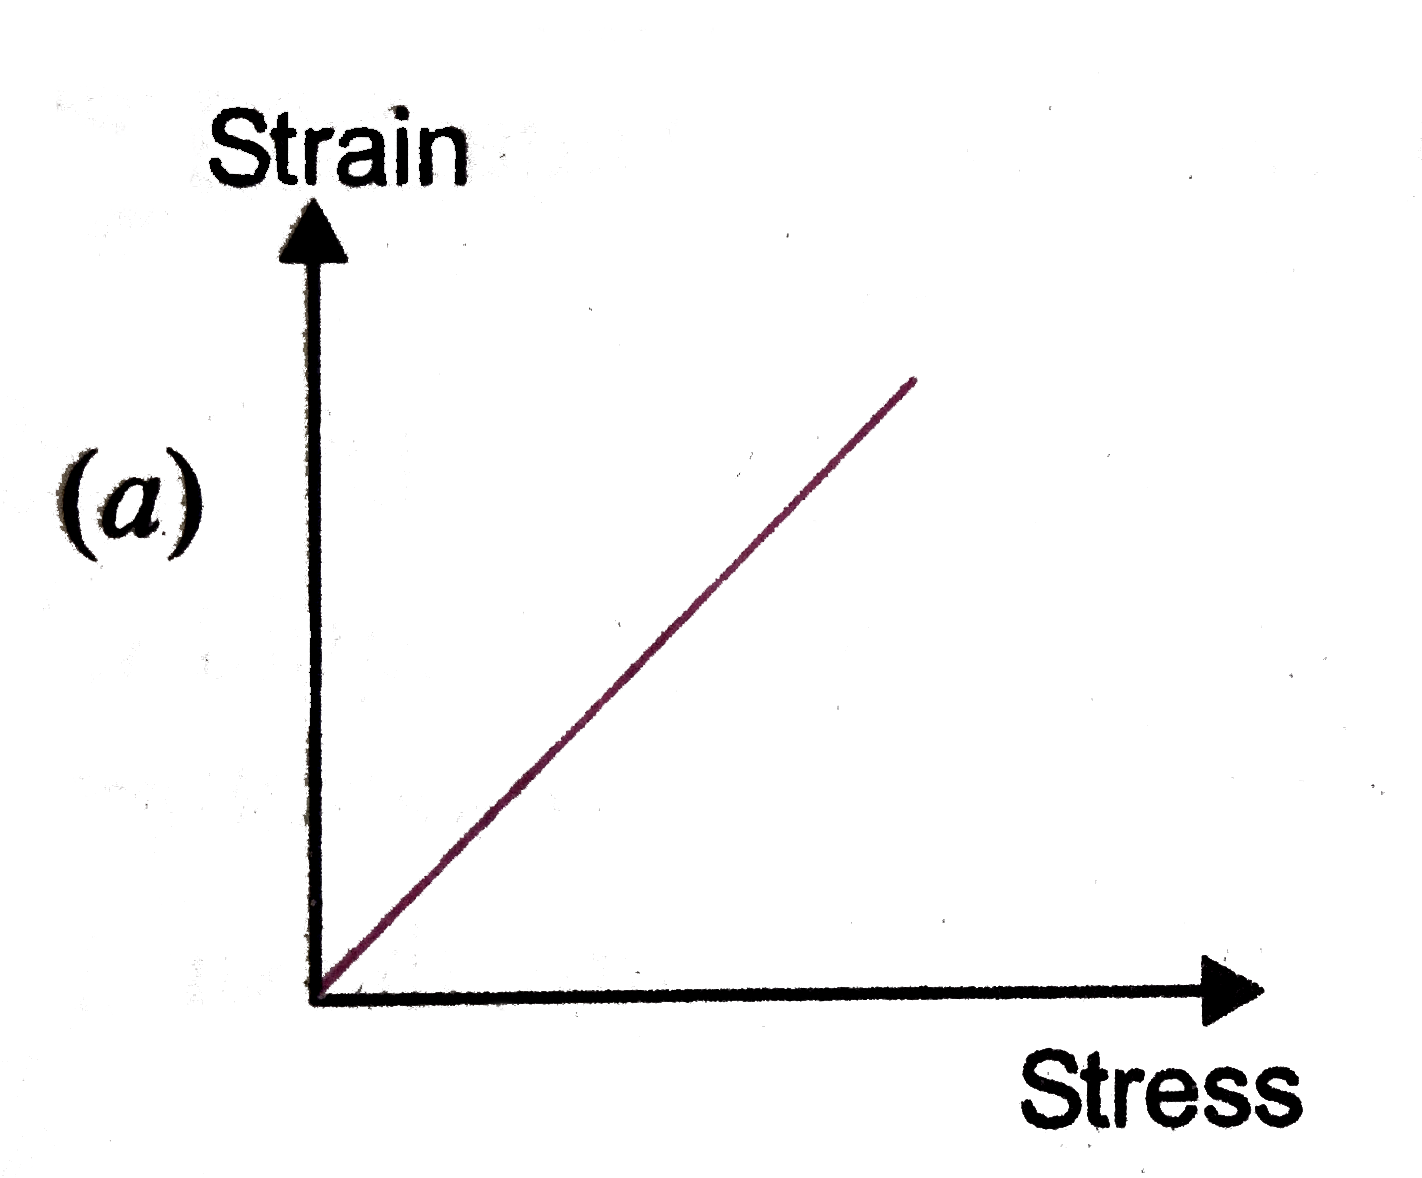
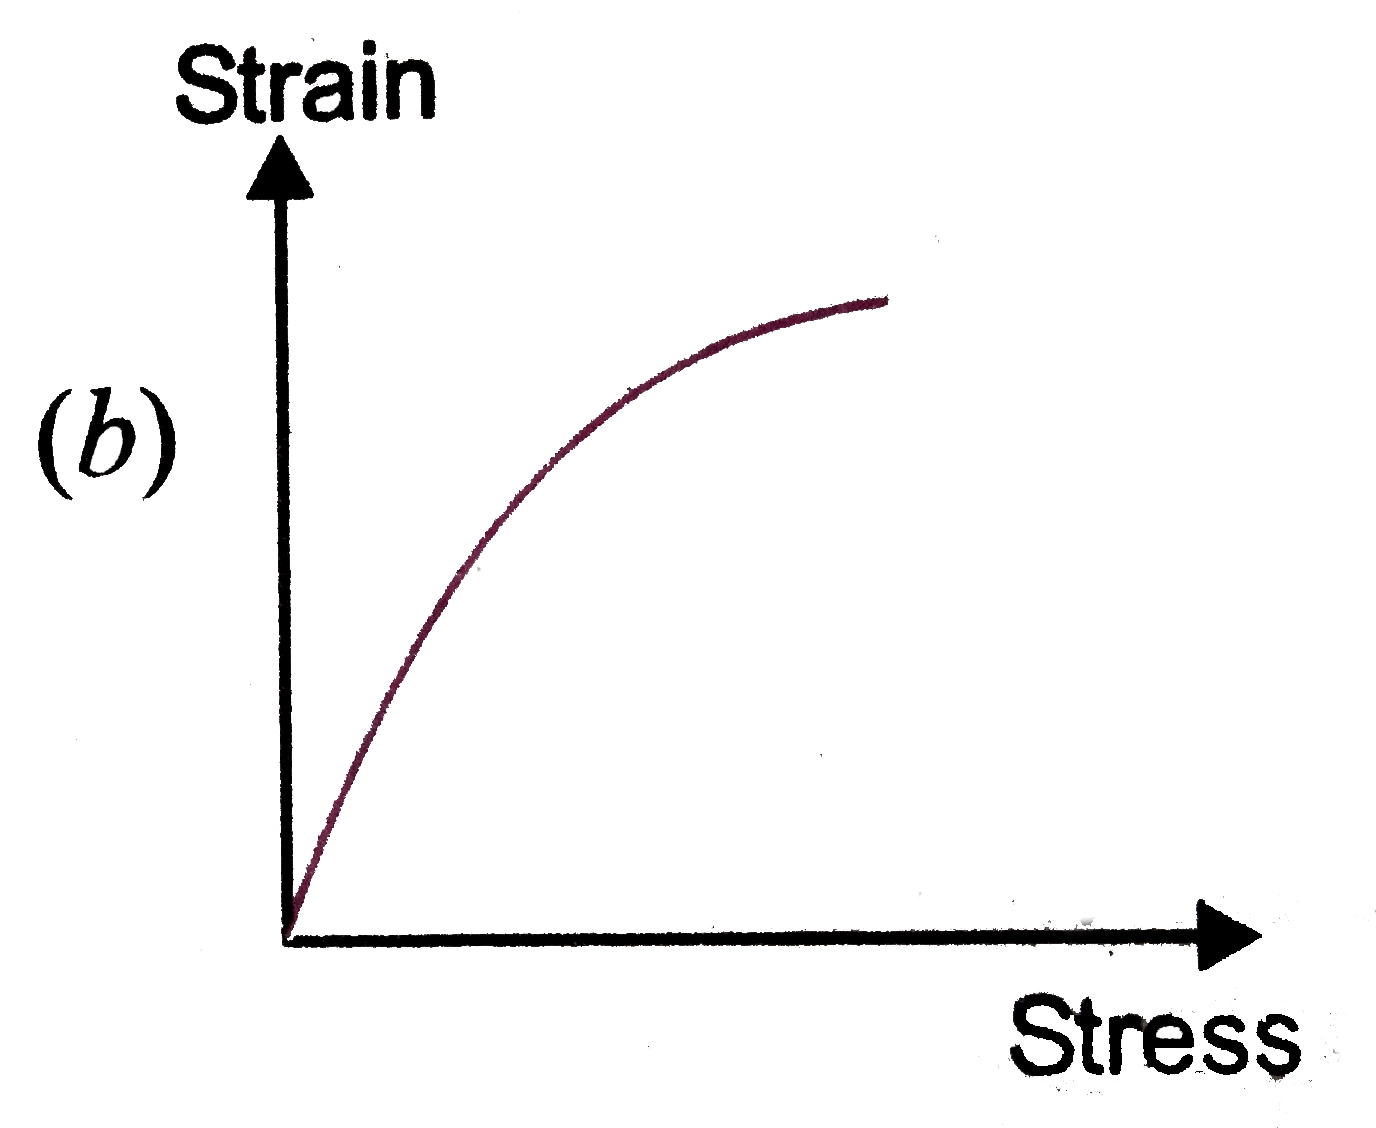
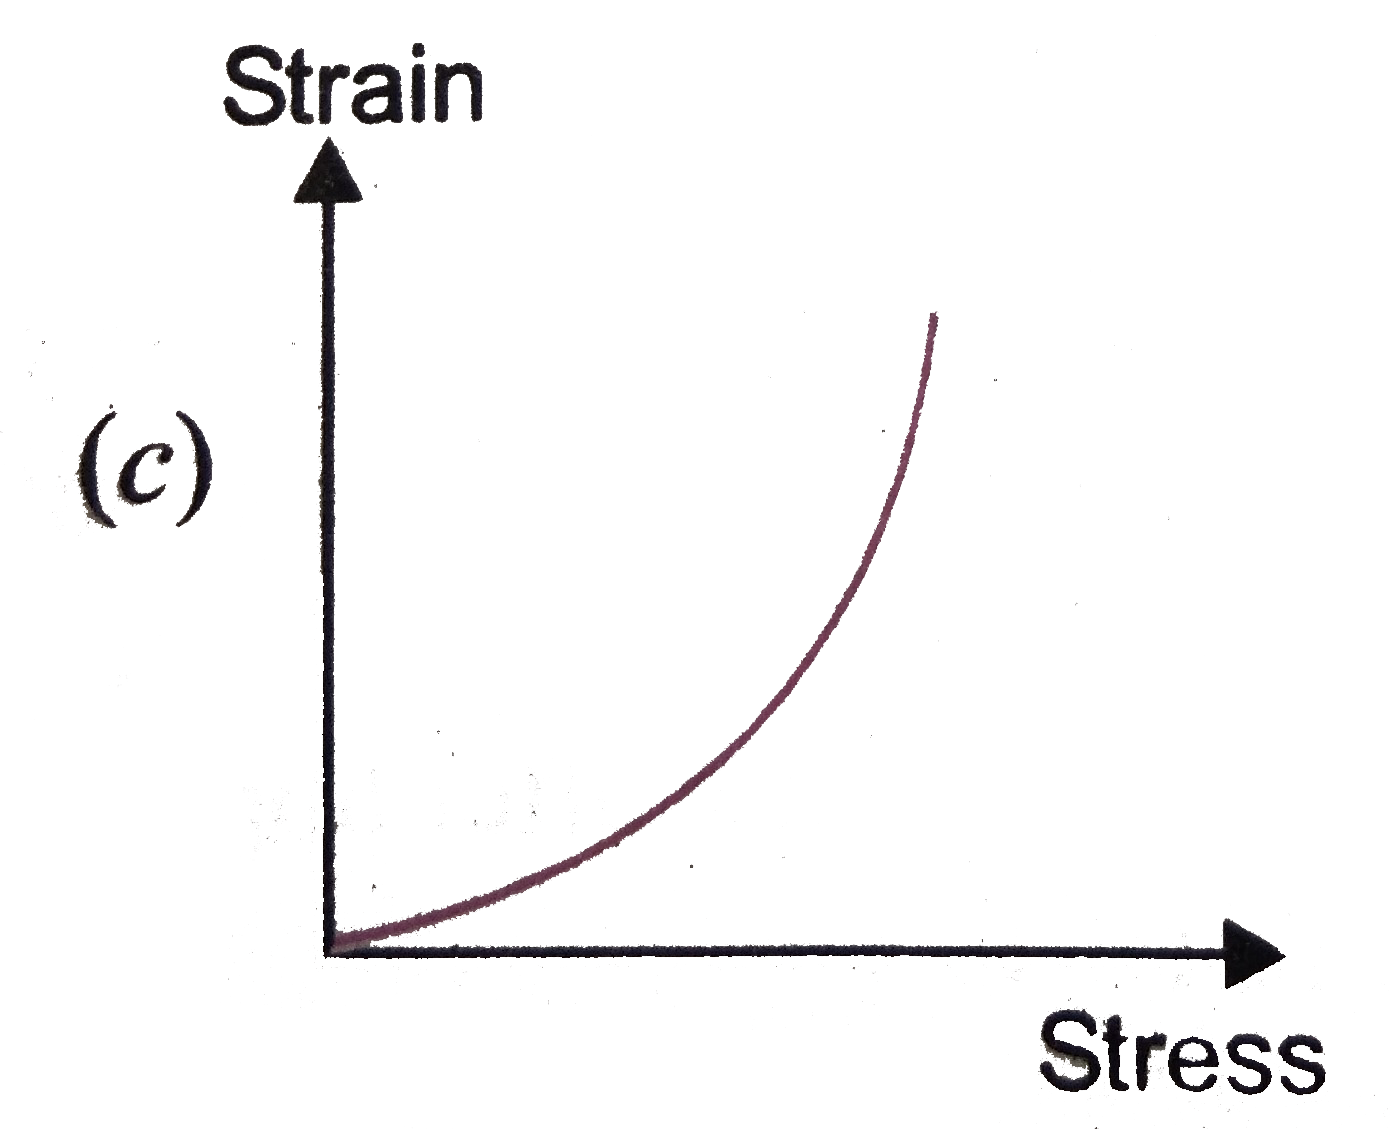
- Which of the following is the graph showing stress-strain variation f...
Text Solution
|
- A square lead slab of side 50 cm and thickness 10 cm is subjected to a...
Text Solution
|
- A steel wire of diameter 2 mm has a breaking strength of 4xx10^(5)N. W...
Text Solution
|
- What is the greatest length of copper wire that can hang without break...
Text Solution
|
- What is the percentage increase in length of a wire of diameter 2.5 mm...
Text Solution
|
- Two wires of equal length and cross sectional area suspended as shown ...
Text Solution
|