Text Solution
Verified by Experts


Topper's Solved these Questions
THERMODYNAMICS
PRADEEP|Exercise Very short answer questions|31 VideosTHERMODYNAMICS
PRADEEP|Exercise Short answer questions|23 VideosTHERMODYNAMICS
PRADEEP|Exercise Solved examples|34 VideosSYSTEMS OF PARTICLES AND ROTATIONAL MOTION
PRADEEP|Exercise Assertion- Reason Type questions|20 VideosWORK, ENERGY AND POWER
PRADEEP|Exercise Assertion-Reason Type Questions|24 Videos
Similar Questions
Explore conceptually related problems
PRADEEP-THERMODYNAMICS-Conceptual Problems
- The volume of an ideal gas is V at pressure P. On increasing the press...
Text Solution
|
- Identify isothermal and adiabatic process in the following diagram
Text Solution
|
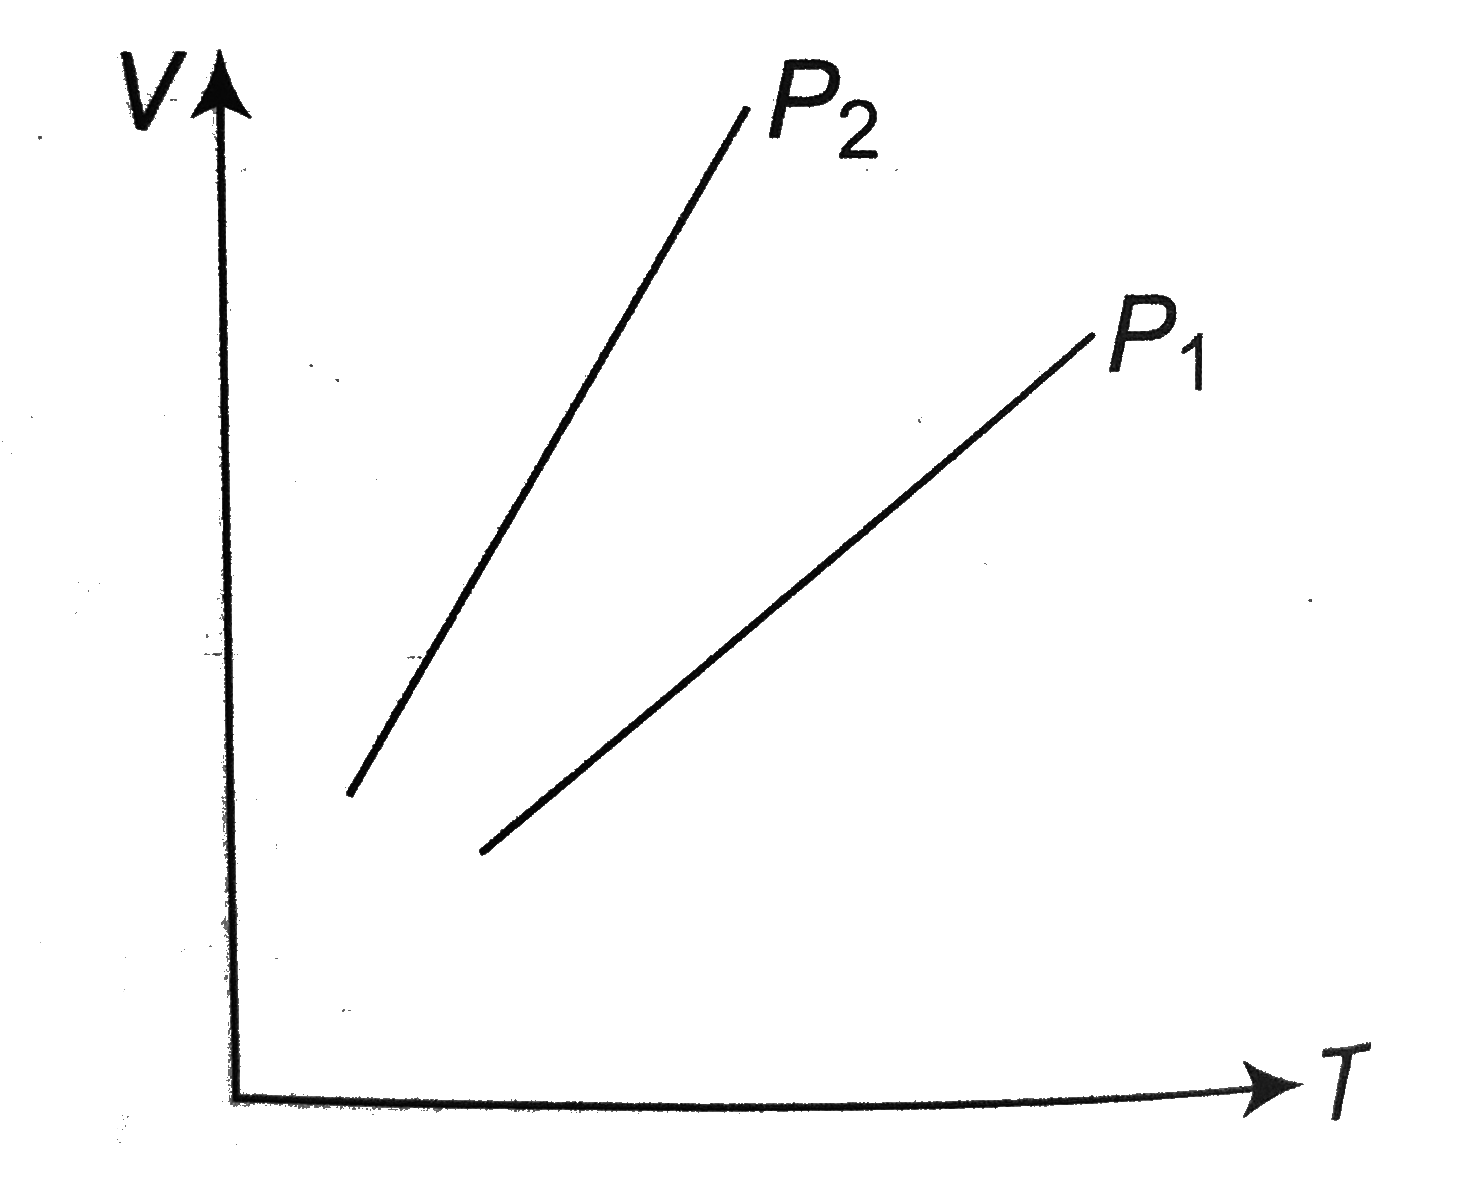
- Figure shows the volume versus temperature graph for the same mass of ...
Text Solution
|
- Can water be boiled without heating?
Text Solution
|
- Can we increase the temperature of a gas without supplying heat to it?
Text Solution
|
- Is the heat supplied to a system always equal to the increase in its i...
Text Solution
|
- Is the internal energy of a gas a function of the pressure? Explain.
Text Solution
|
- Why is conversion of heat into work not possible without a sink at low...
Text Solution
|
- First law of thermodynamics does not forbid flow of heat from lower te...
Text Solution
|
- If on giving 40 joul e of heat to a system, work done on the system i...
Text Solution
|
- How does internal energy of a gas change in (i) isothermal expansion (...
Text Solution
|
- A system goes from A and B via two processes. I and II as shown in fig...
Text Solution
|
- Give two examples of reversible processes. Discuss their reversibility...
Text Solution
|
- A refrigerator transfers heat from the cold coling coils to the warm ...
Text Solution
|
- Can the Carnot engine be realised in practice?
Text Solution
|
- No real engine can have an efficiency greater than that of a carnot en...
Text Solution
|
- A heat engine coverts disordered mechanical motion into ordered mechan...
Text Solution
|
- What is meant by reversible process? Explain why the efficiency of a r...
Text Solution
|
- Why can a ship not use the internal energy of sea water to operate its...
Text Solution
|
- What is the significance of area of closed curve on P-V diagrams?
Text Solution
|