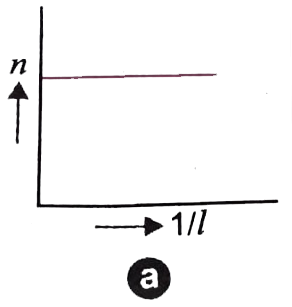
A
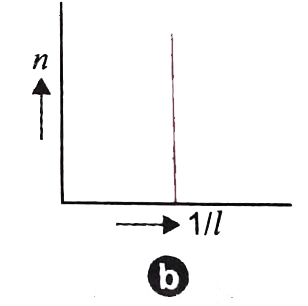
B
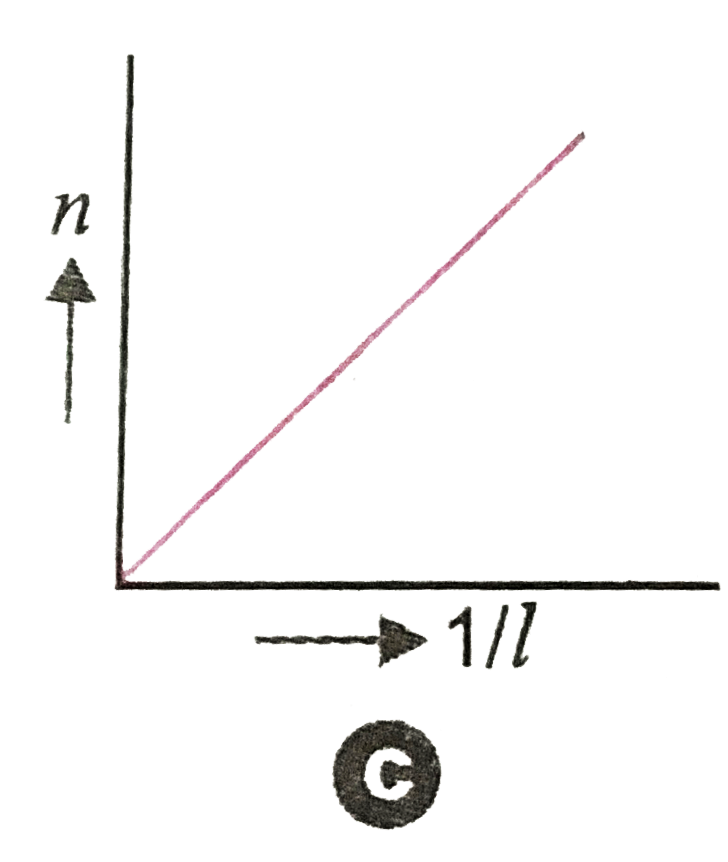
C
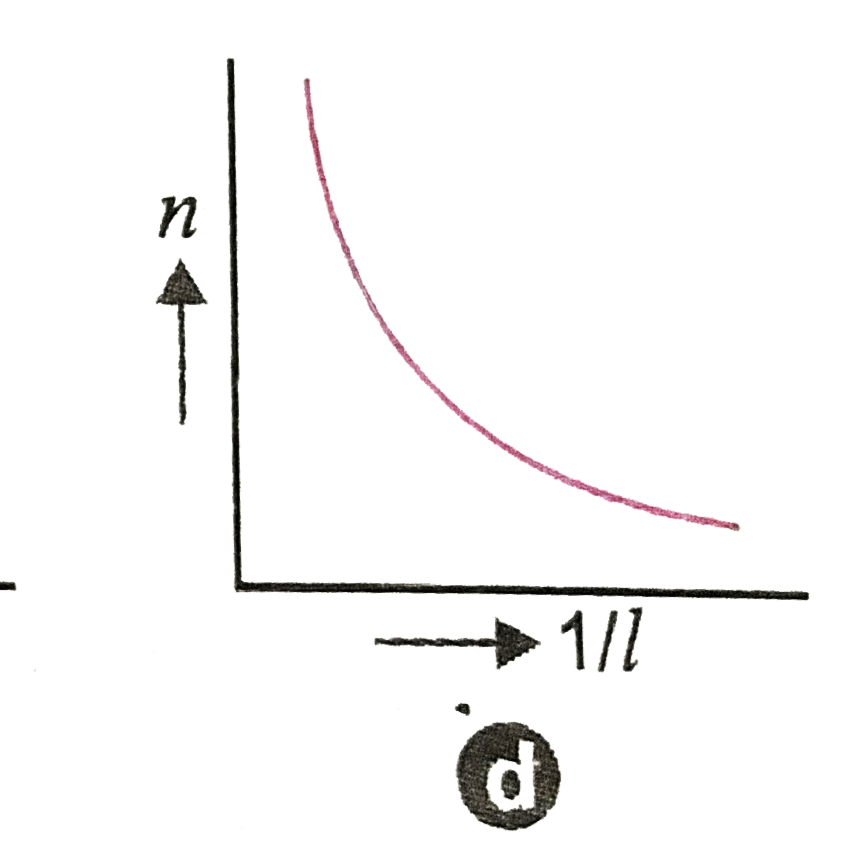
D
Text Solution
Verified by Experts
The correct Answer is:


Topper's Solved these Questions
Similar Questions
Explore conceptually related problems
PRADEEP-OSCILLATIONS AND WAVES-multiple choice Questions
- What will be the time of oscialltion, If the length of a second pendul...
Text Solution
|
- If the length of a correct pendulum clock is raised by 0.1%, what will...
Text Solution
|
- In damped oscillations, the amplitude of oscillations is reduced to on...
Text Solution
|
- What is the frequency of a second's pendulum in an elevator moving up ...
Text Solution
|
- In a sonometer experiment, the graph between frequency n and reciproca...
Text Solution
|
- The square of frquency of vibration (n^(2)) of a given length of sonom...
Text Solution
|
- The first resonance length using a fork of frequency 512 is 16.2cm. Th...
Text Solution
|
- In the resonance apparatus, when water is replaced by mercury, resonan...
Text Solution
|
- The resonance lengths obtained by a student using a fork in resonance ...
Text Solution
|
- In the above experiment, the value of end correction is
Text Solution
|
- A student plots the frequency (n) of given length of a wire stretched ...
Text Solution
|
- How is second resonance length (l(2)) in the resonance apparatus relat...
Text Solution
|
- A student is performing an experiment using a resonance column and a t...
Text Solution
|